Case Studies & Interactive Data
Explore real experimental data and interactive visualizations from validated target profiling studies, featuring comprehensive QC metrics, dose-response analysis, and structural mapping
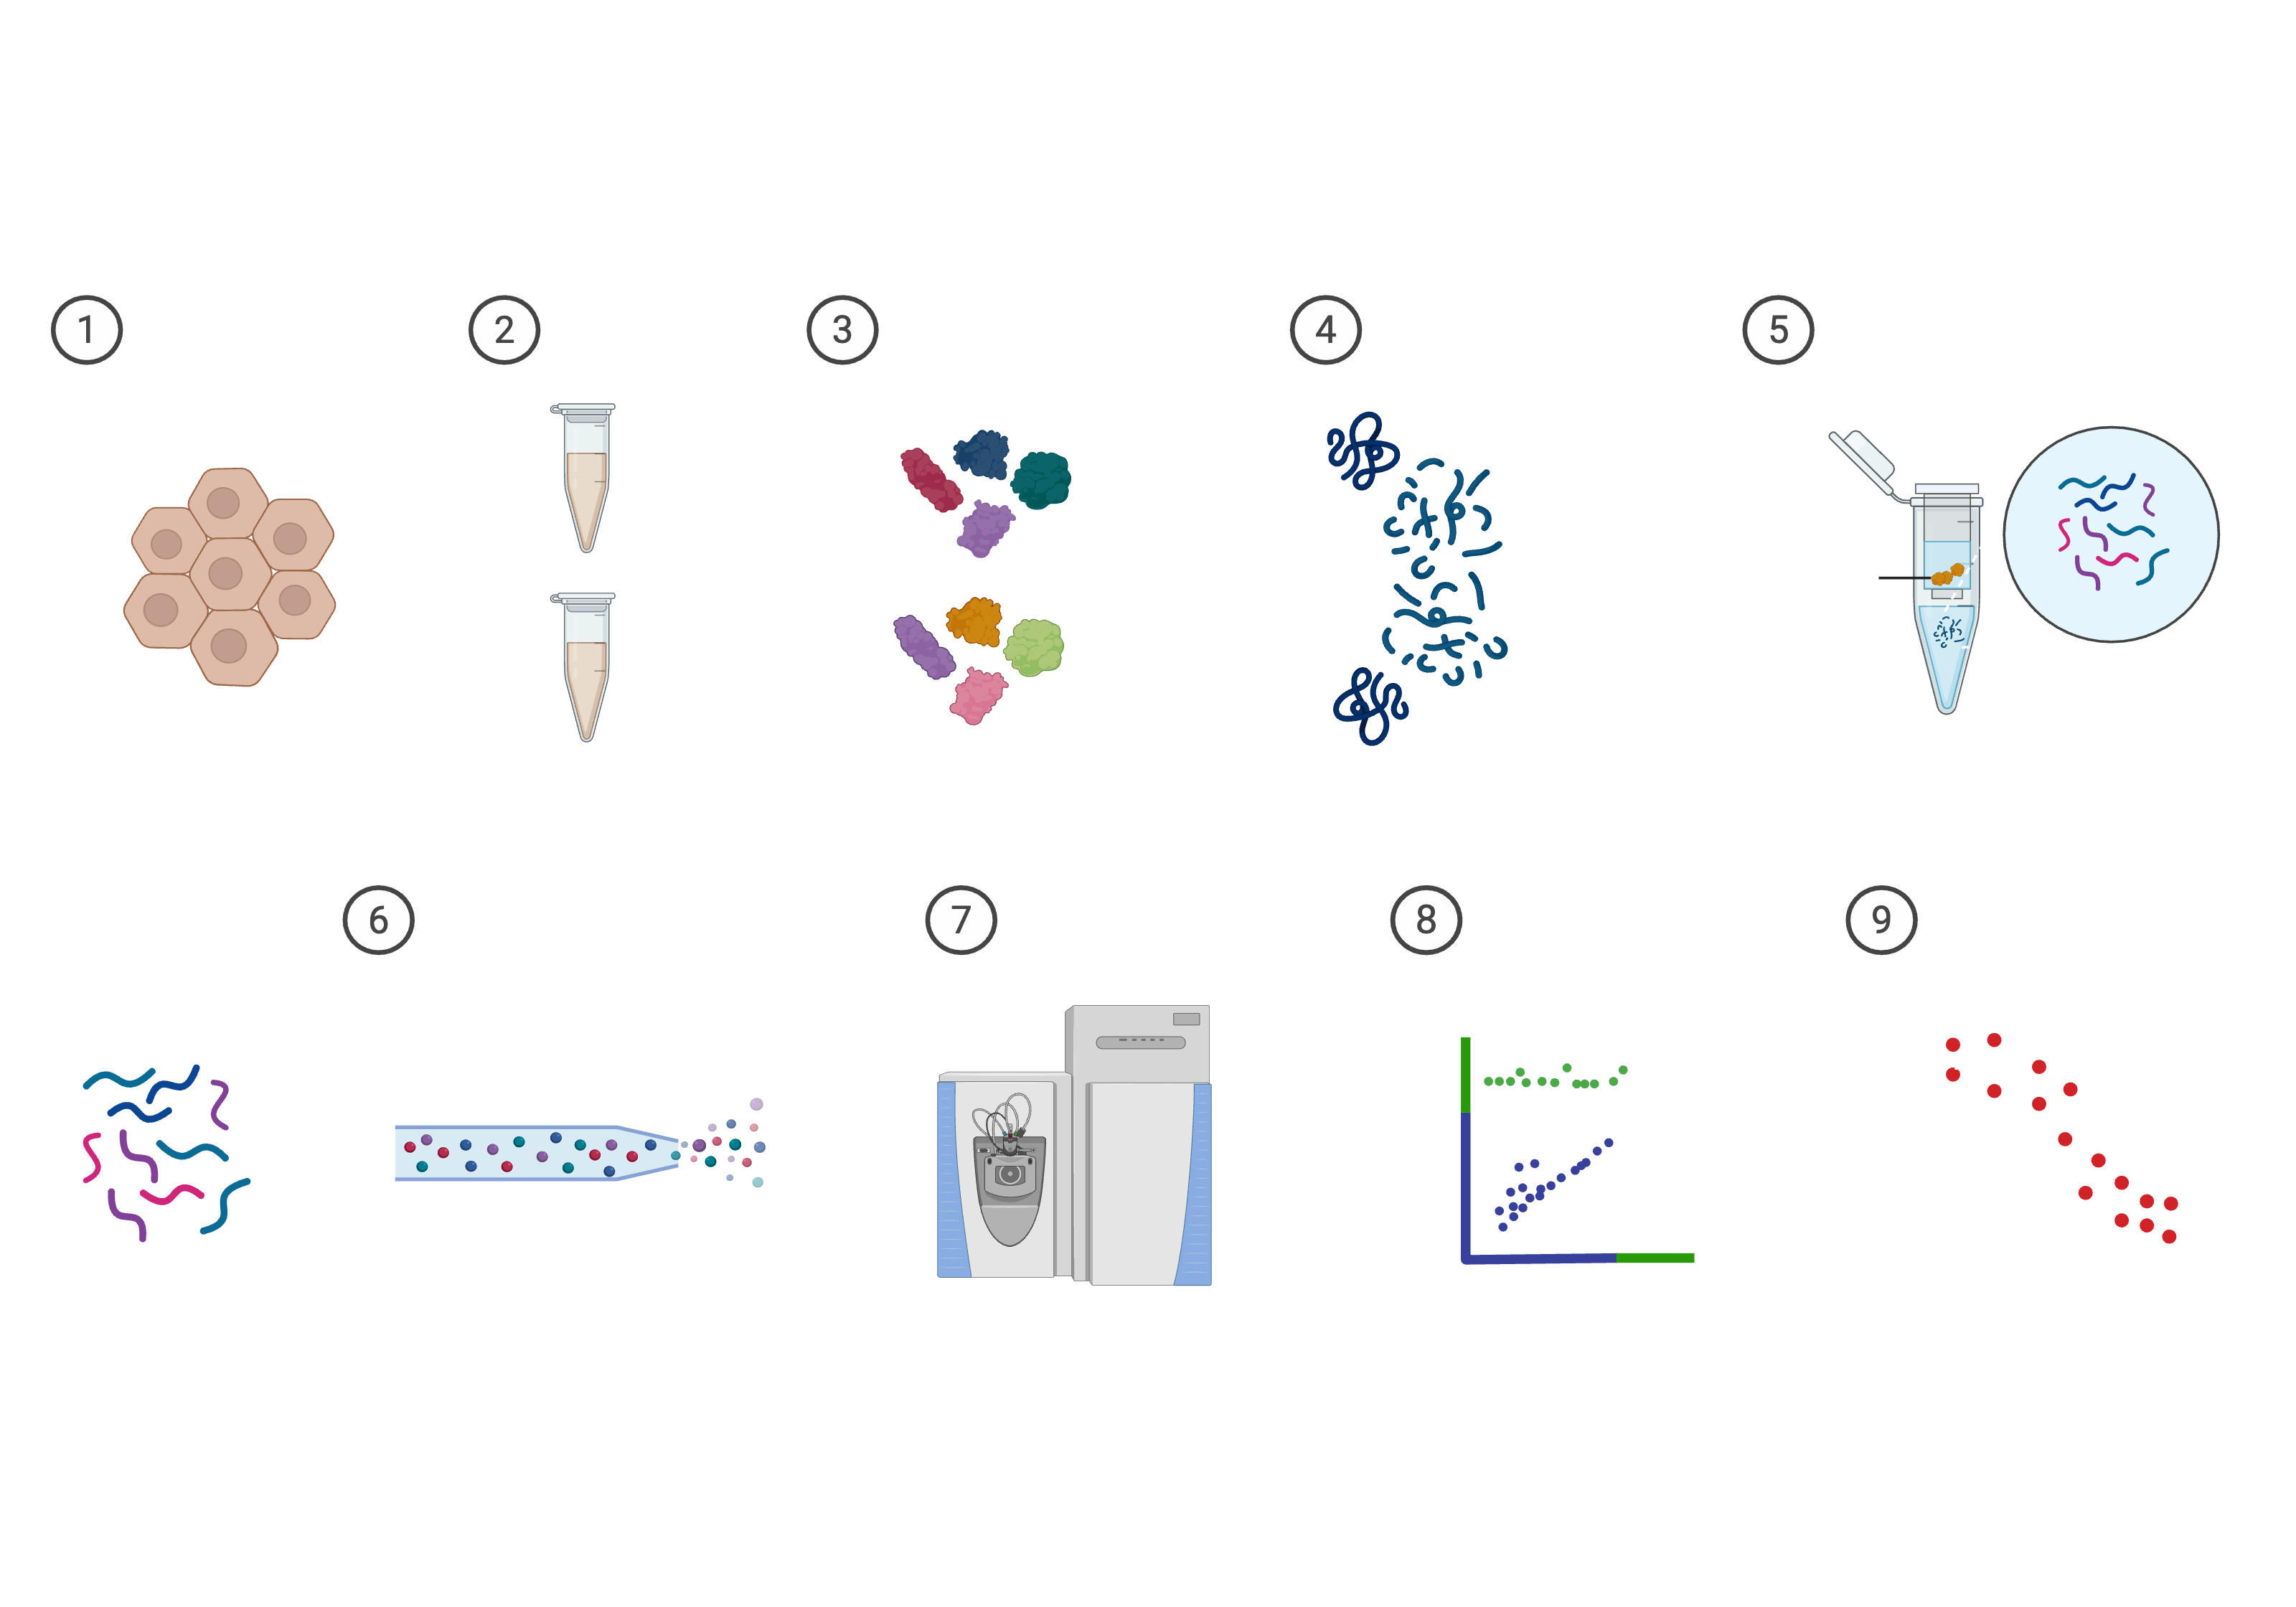
Analysis Workflow
Our systematic approach to target profiling from sample preparation to actionable insights
Case Study 1: MEK1/2 Inhibitor Profiling
Background
This study demonstrates target profiling of a MEK1/2 (MAP2K1/MAP2K2) inhibitor using our DI-PELSA (Data-Independent-Precipitation-based Enzyme-Linked Thermal Shift Assay) platform. The study was conducted in A549 lung cancer cells to identify on-target and potential off-target interactions. Multiple peptides from MAP2K1 and MAP2K2 showed strong dose-dependent responses, confirming specific target engagement.
Quality Control Analysis
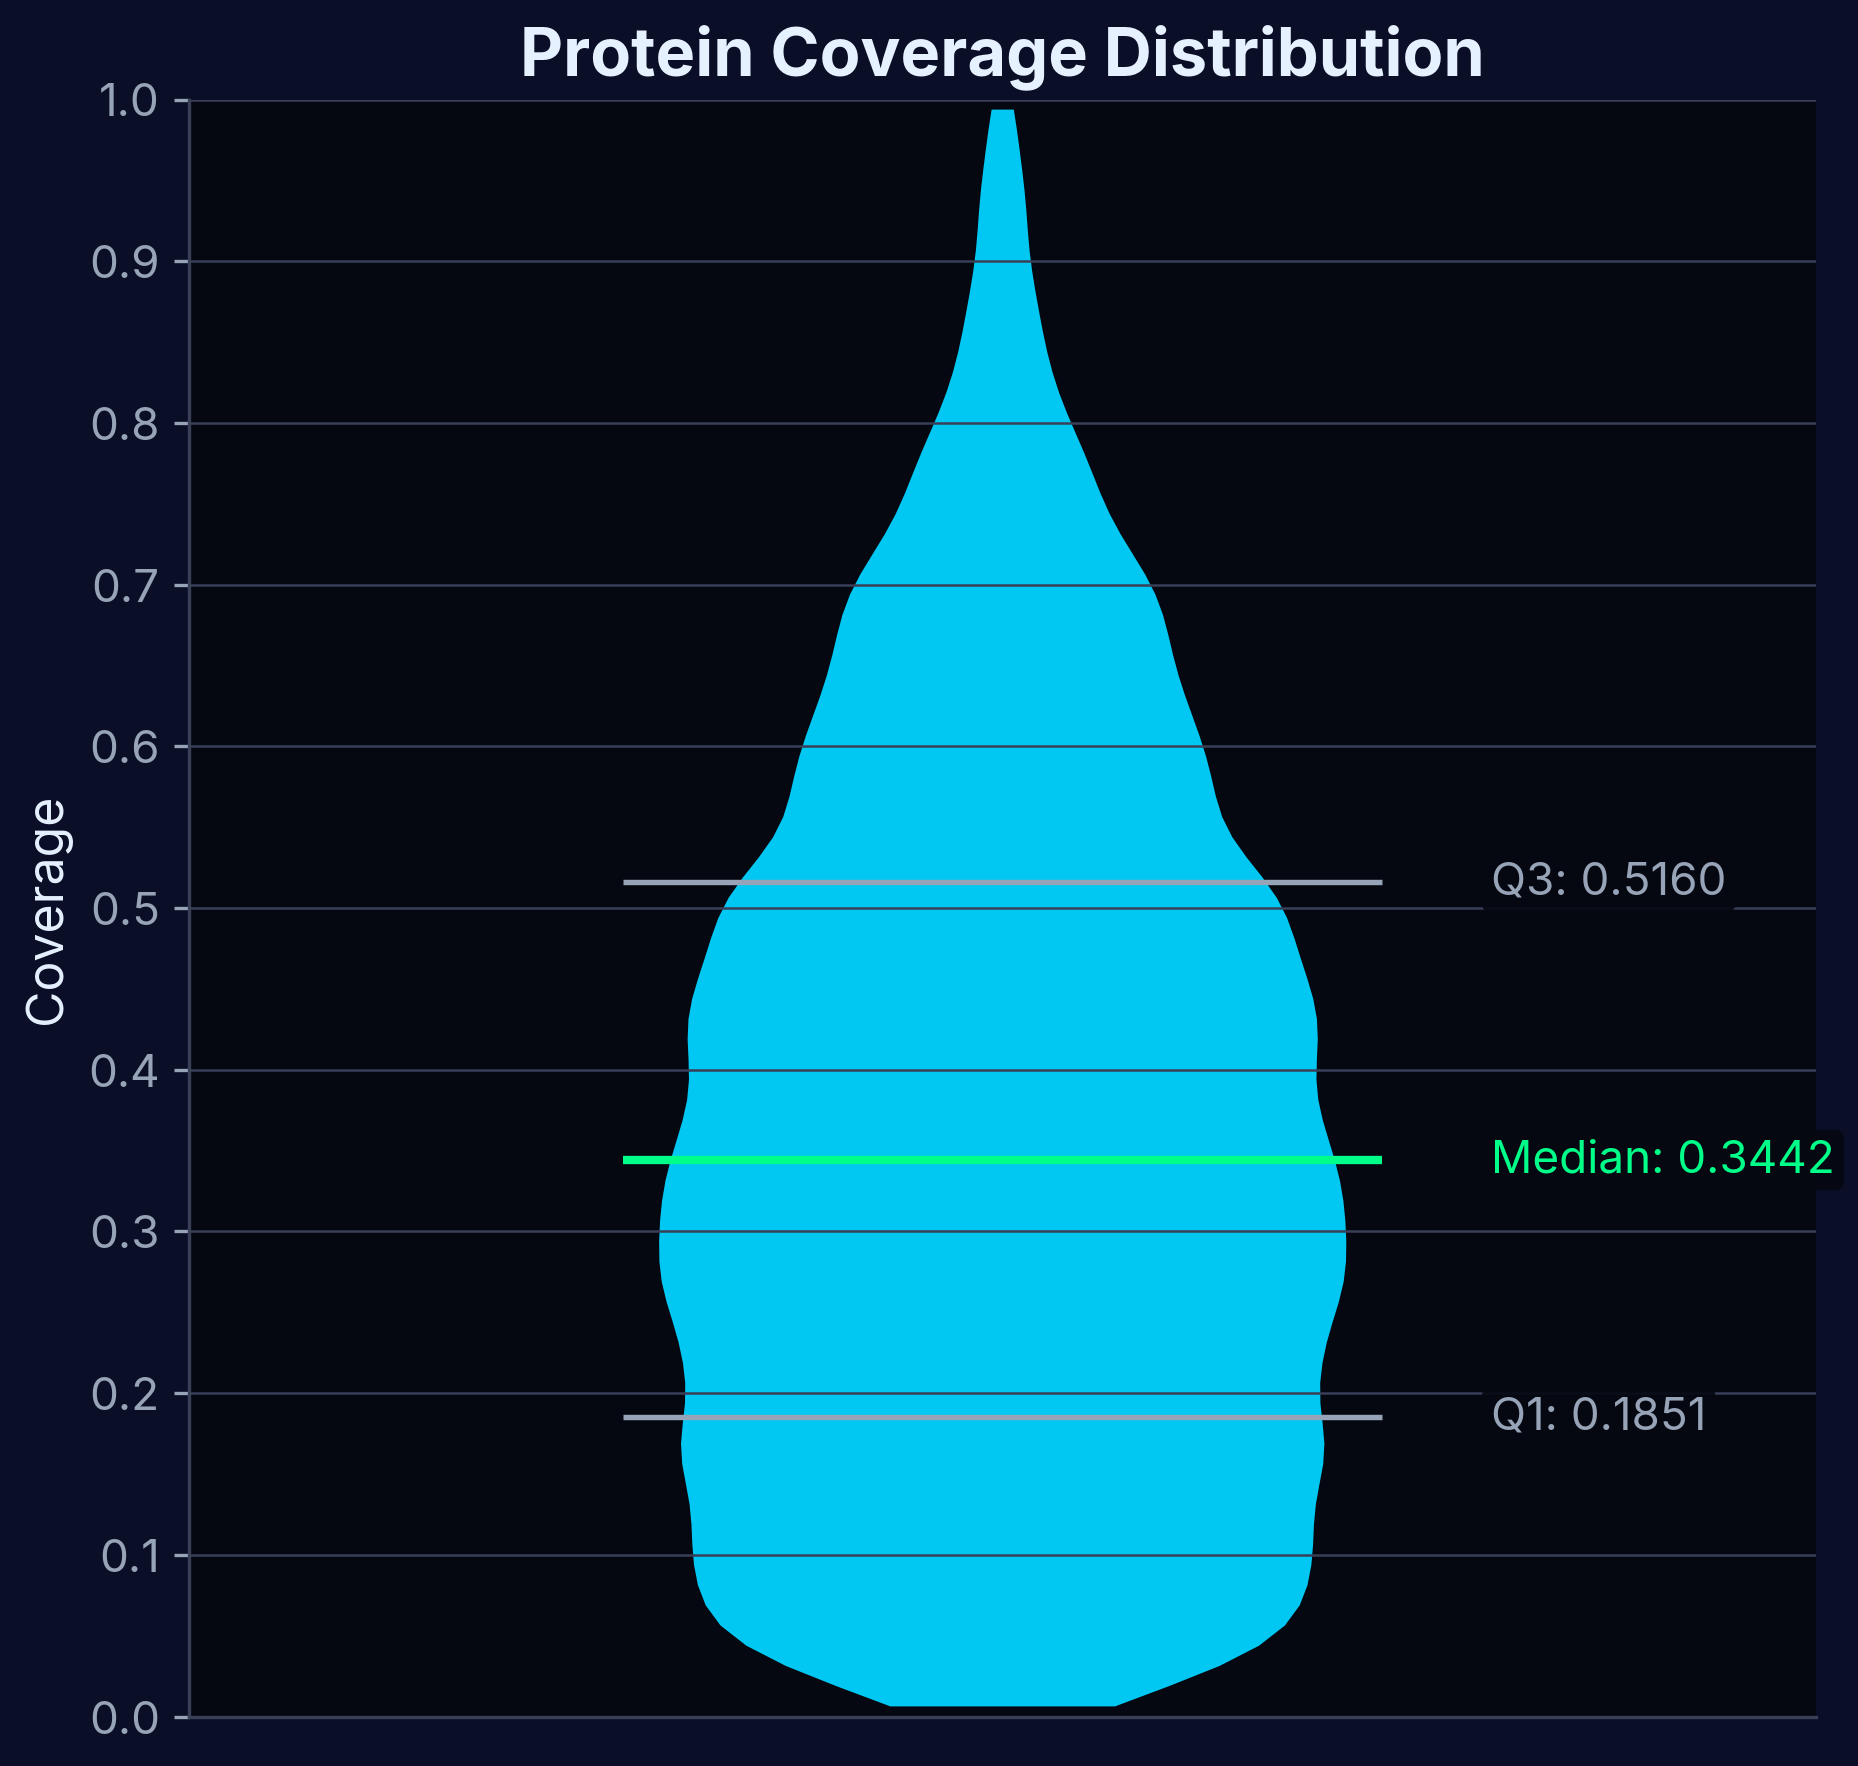
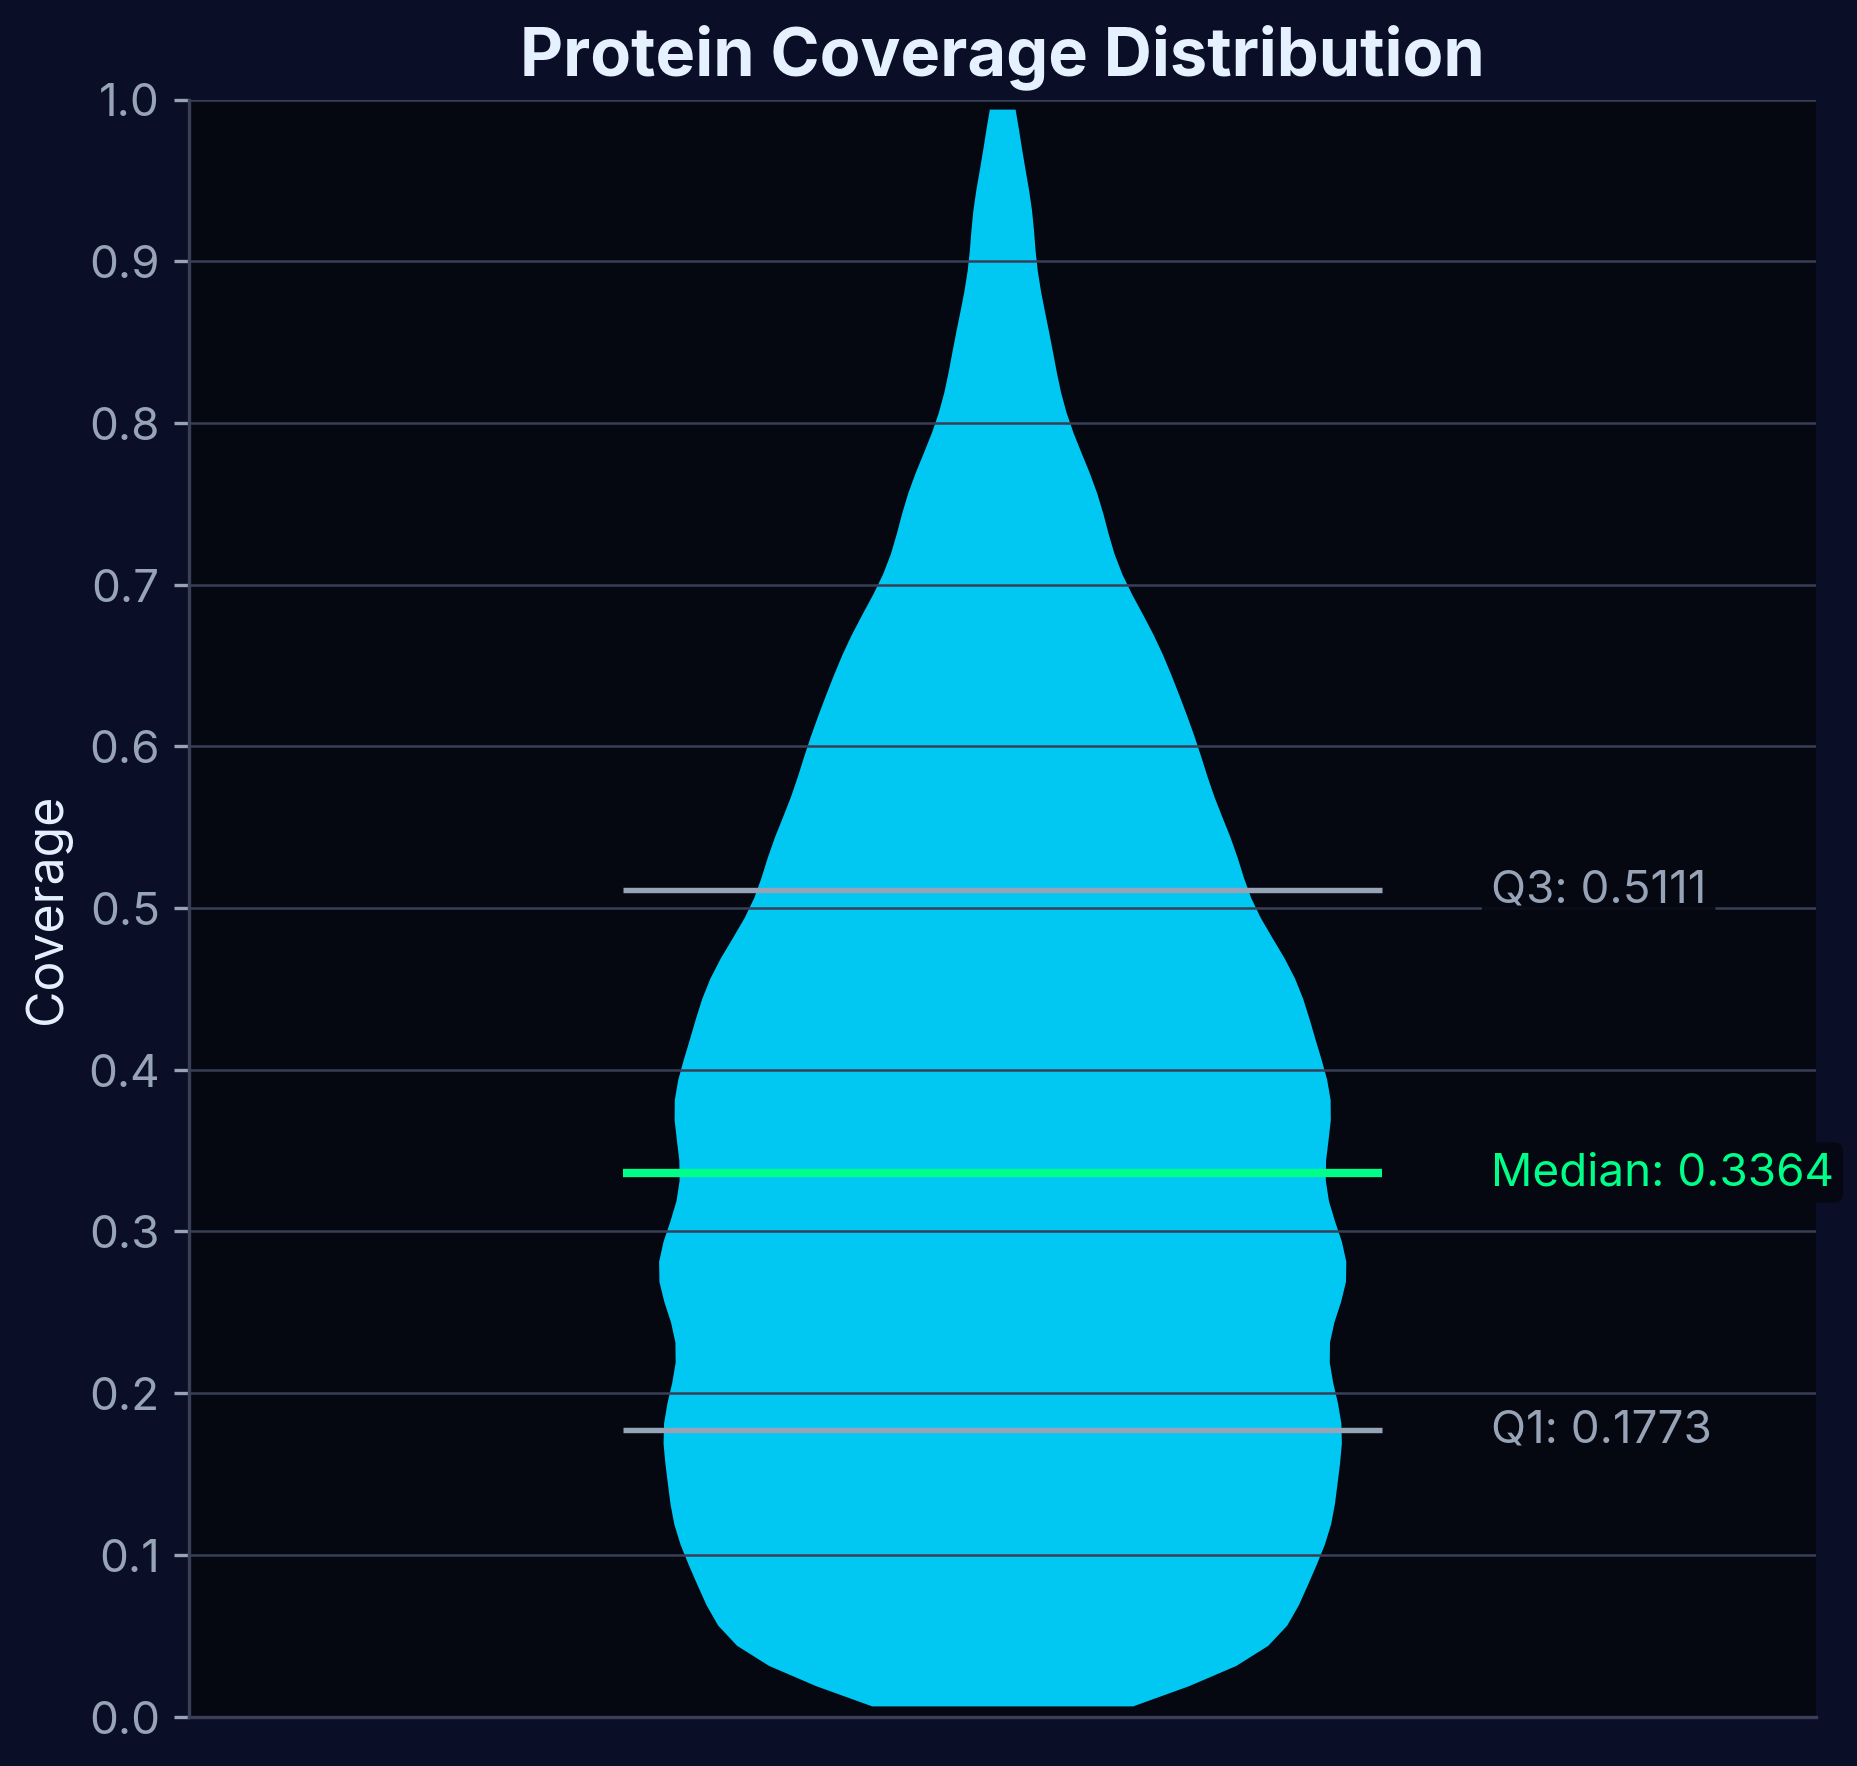
Protein Coverage
Distribution of protein identification across different experimental conditions. High coverage ensures comprehensive target screening across the proteome.
Identification Counts
Number of identified features across all experimental conditions, demonstrating comprehensive proteome coverage and consistent detection rates.
| Feature | CON1 | CON2 | CON3 | CON4 | CON5 | CON6 | CON7 | CON8 | All |
|---|---|---|---|---|---|---|---|---|---|
| Precursor ID | 275,557 | 275,336 | 275,164 | 275,622 | 274,319 | 275,121 | 275,643 | 275,713 | 277,234 |
| Modified Sequence | 212,605 | 212,486 | 212,331 | 212,738 | 211,716 | 212,346 | 212,762 | 212,782 | 213,910 |
| Stripped Sequence | 195,009 | 194,876 | 194,638 | 195,093 | 194,201 | 194,823 | 195,126 | 195,178 | 196,123 |
| Protein Accessions | 8,246 | 8,243 | 8,243 | 8,247 | 8,237 | 8,245 | 8,246 | 8,237 | 8,251 |
Interactive Volcano Plot
Explore the complete dataset interactively. The volcano plot visualizes statistical significance versus effect size for all detected proteins. Hover over data points to view protein details, scores, and statistical metrics. MAP2K1 and MAP2K2 appear as top hits with high significance and large effect sizes.
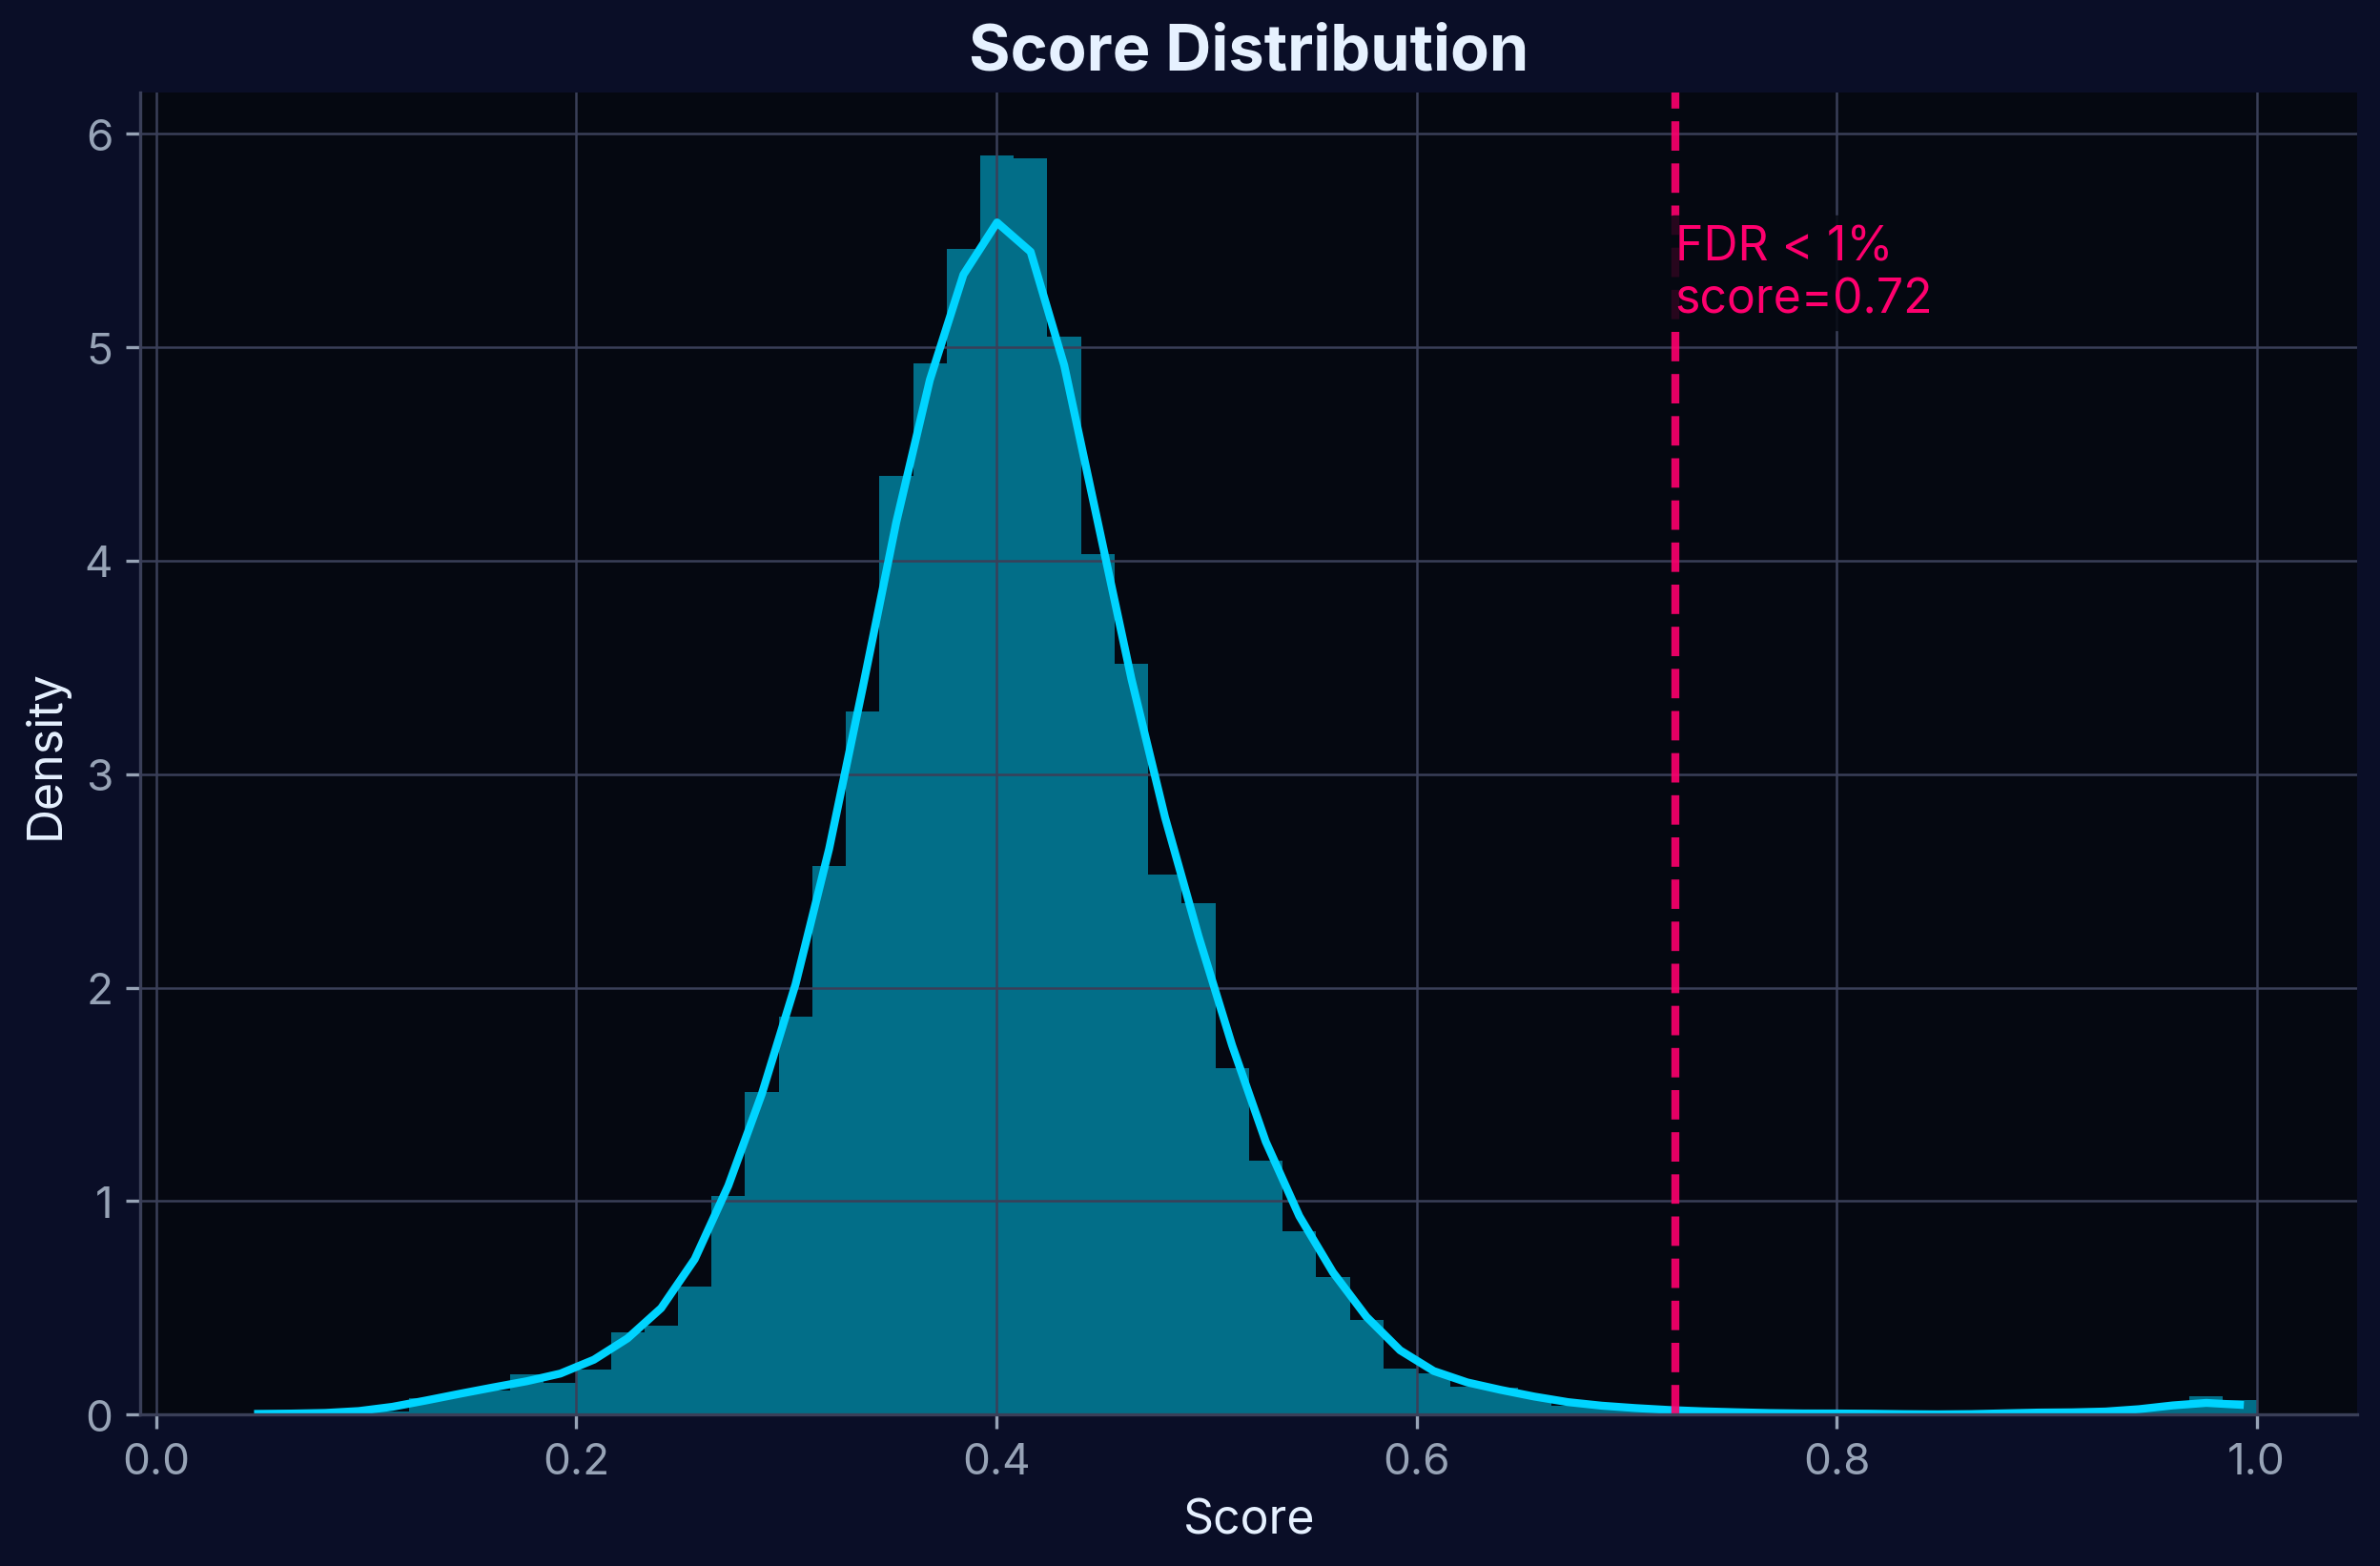
Target Profiling Score
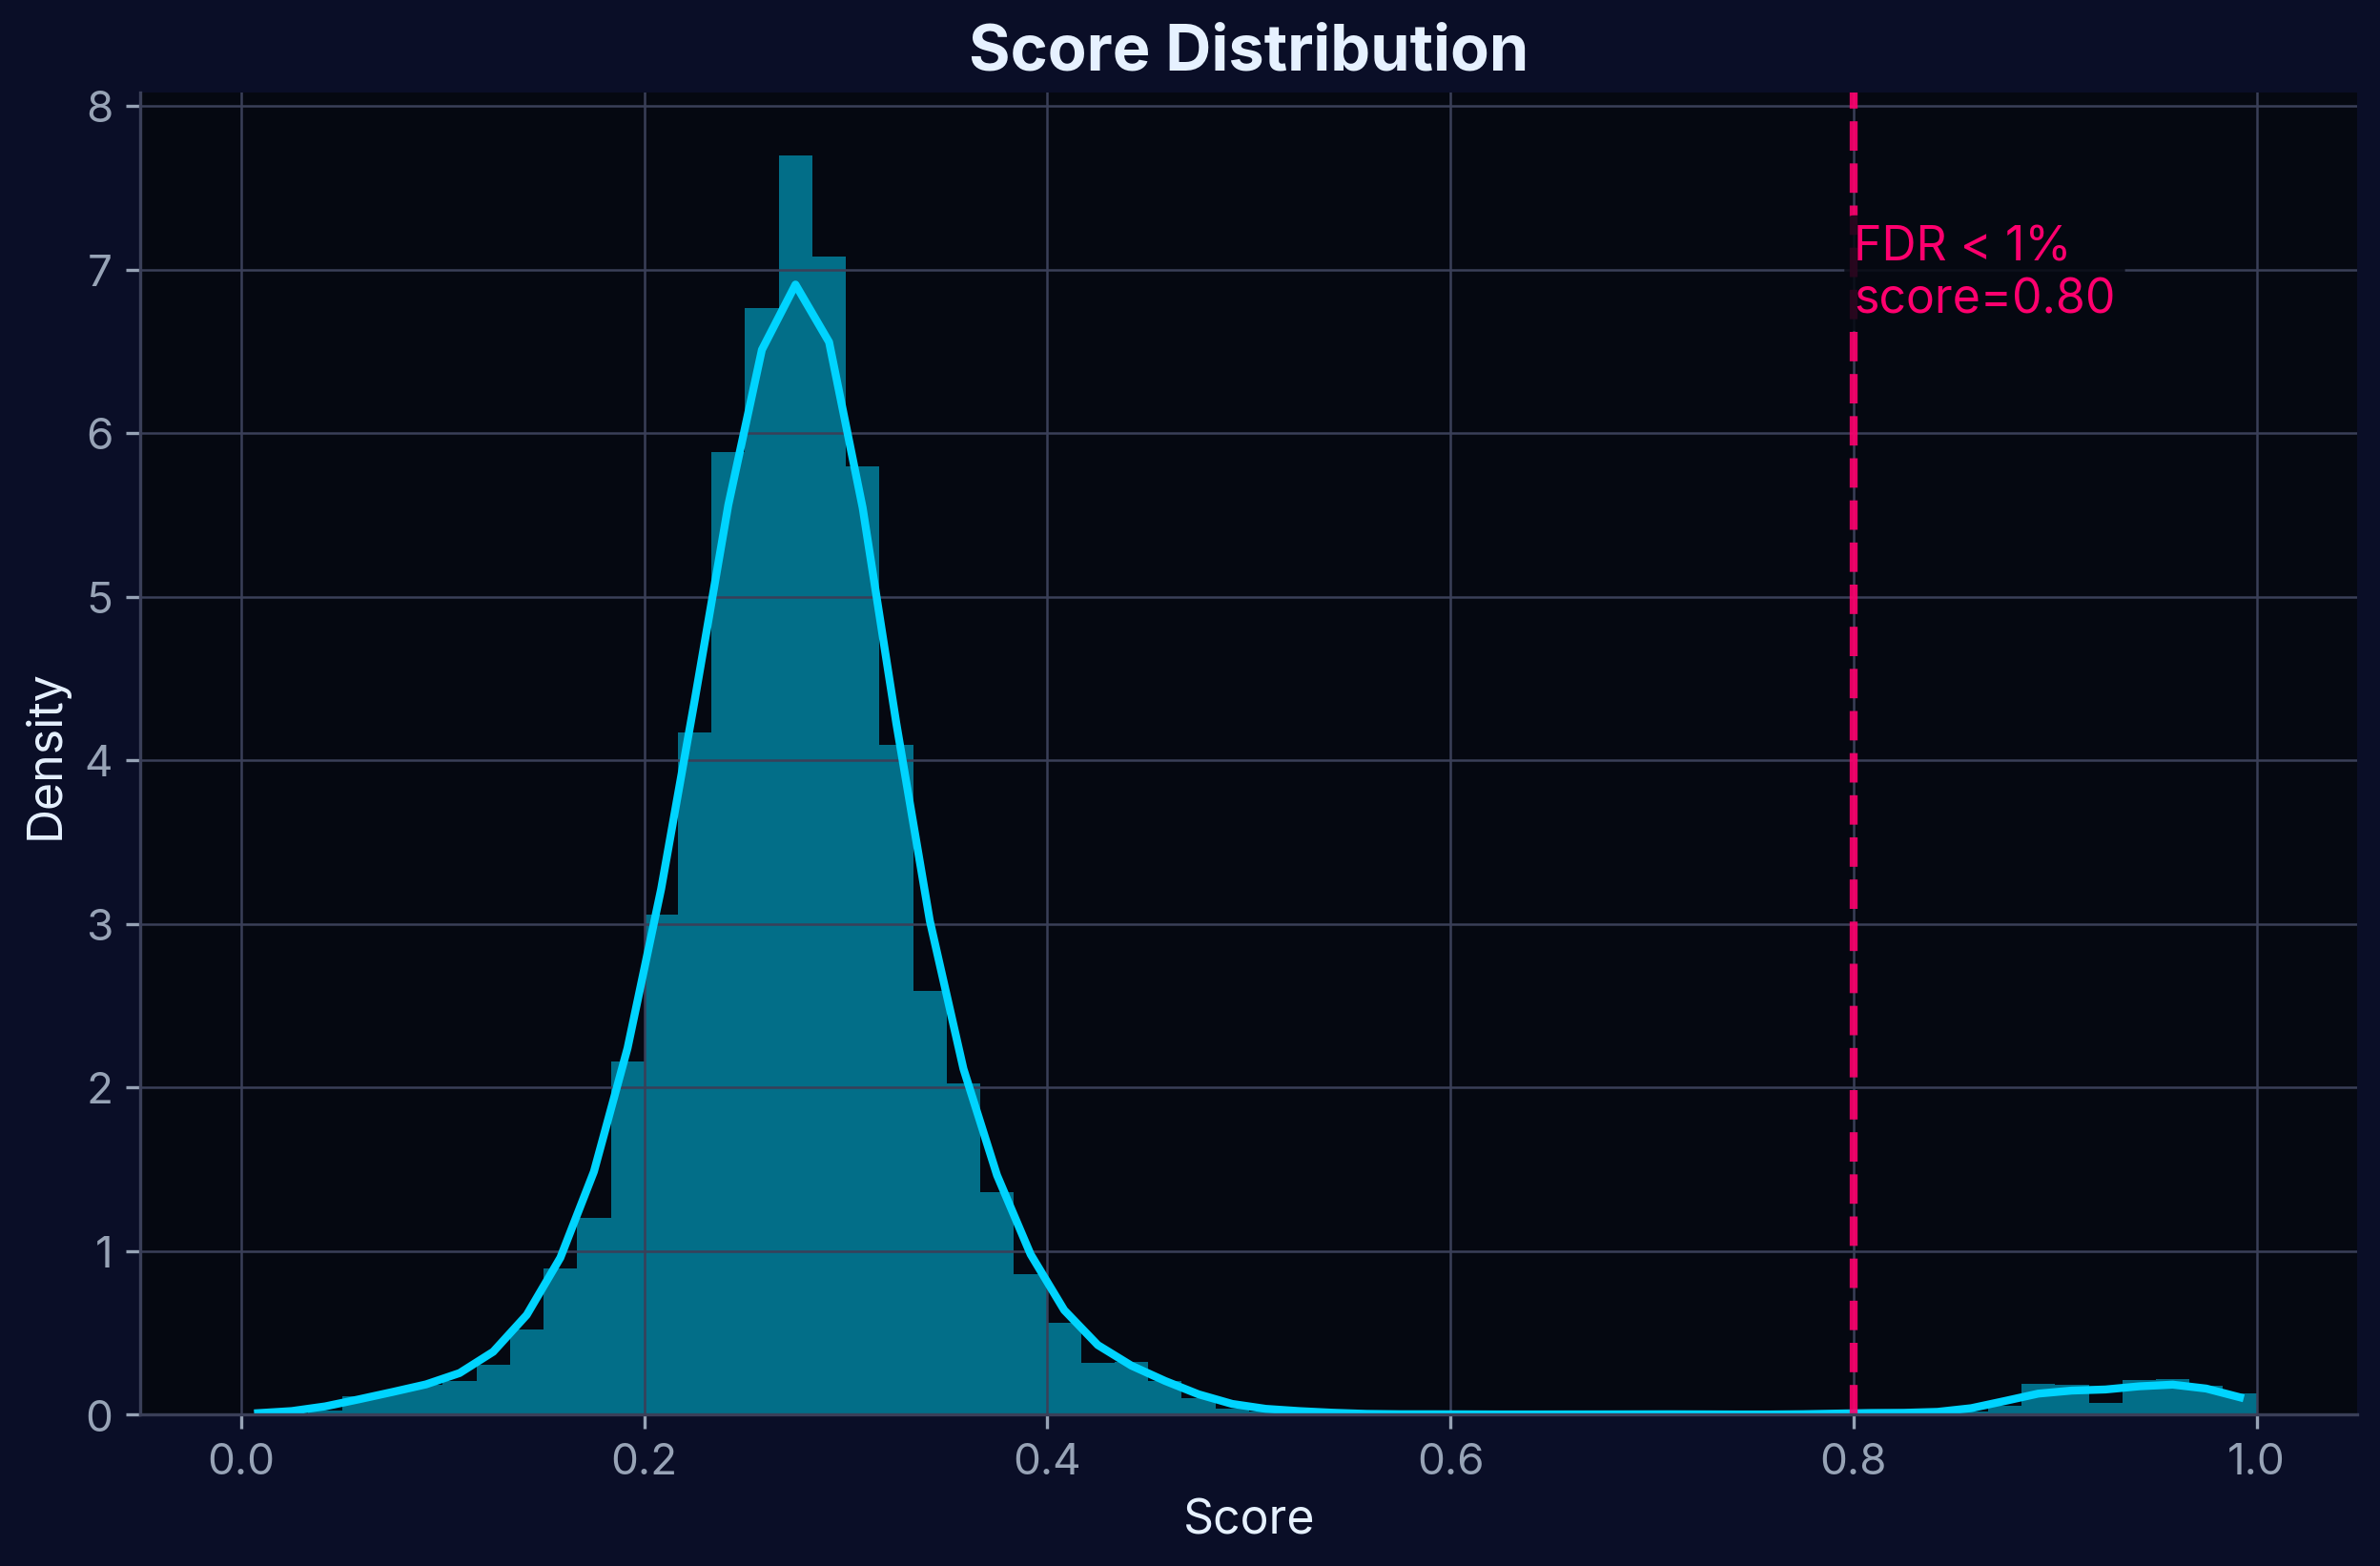
Score Distribution
Distribution of Target Profiling Scores. The score combines multiple experimental features to rank potential targets.
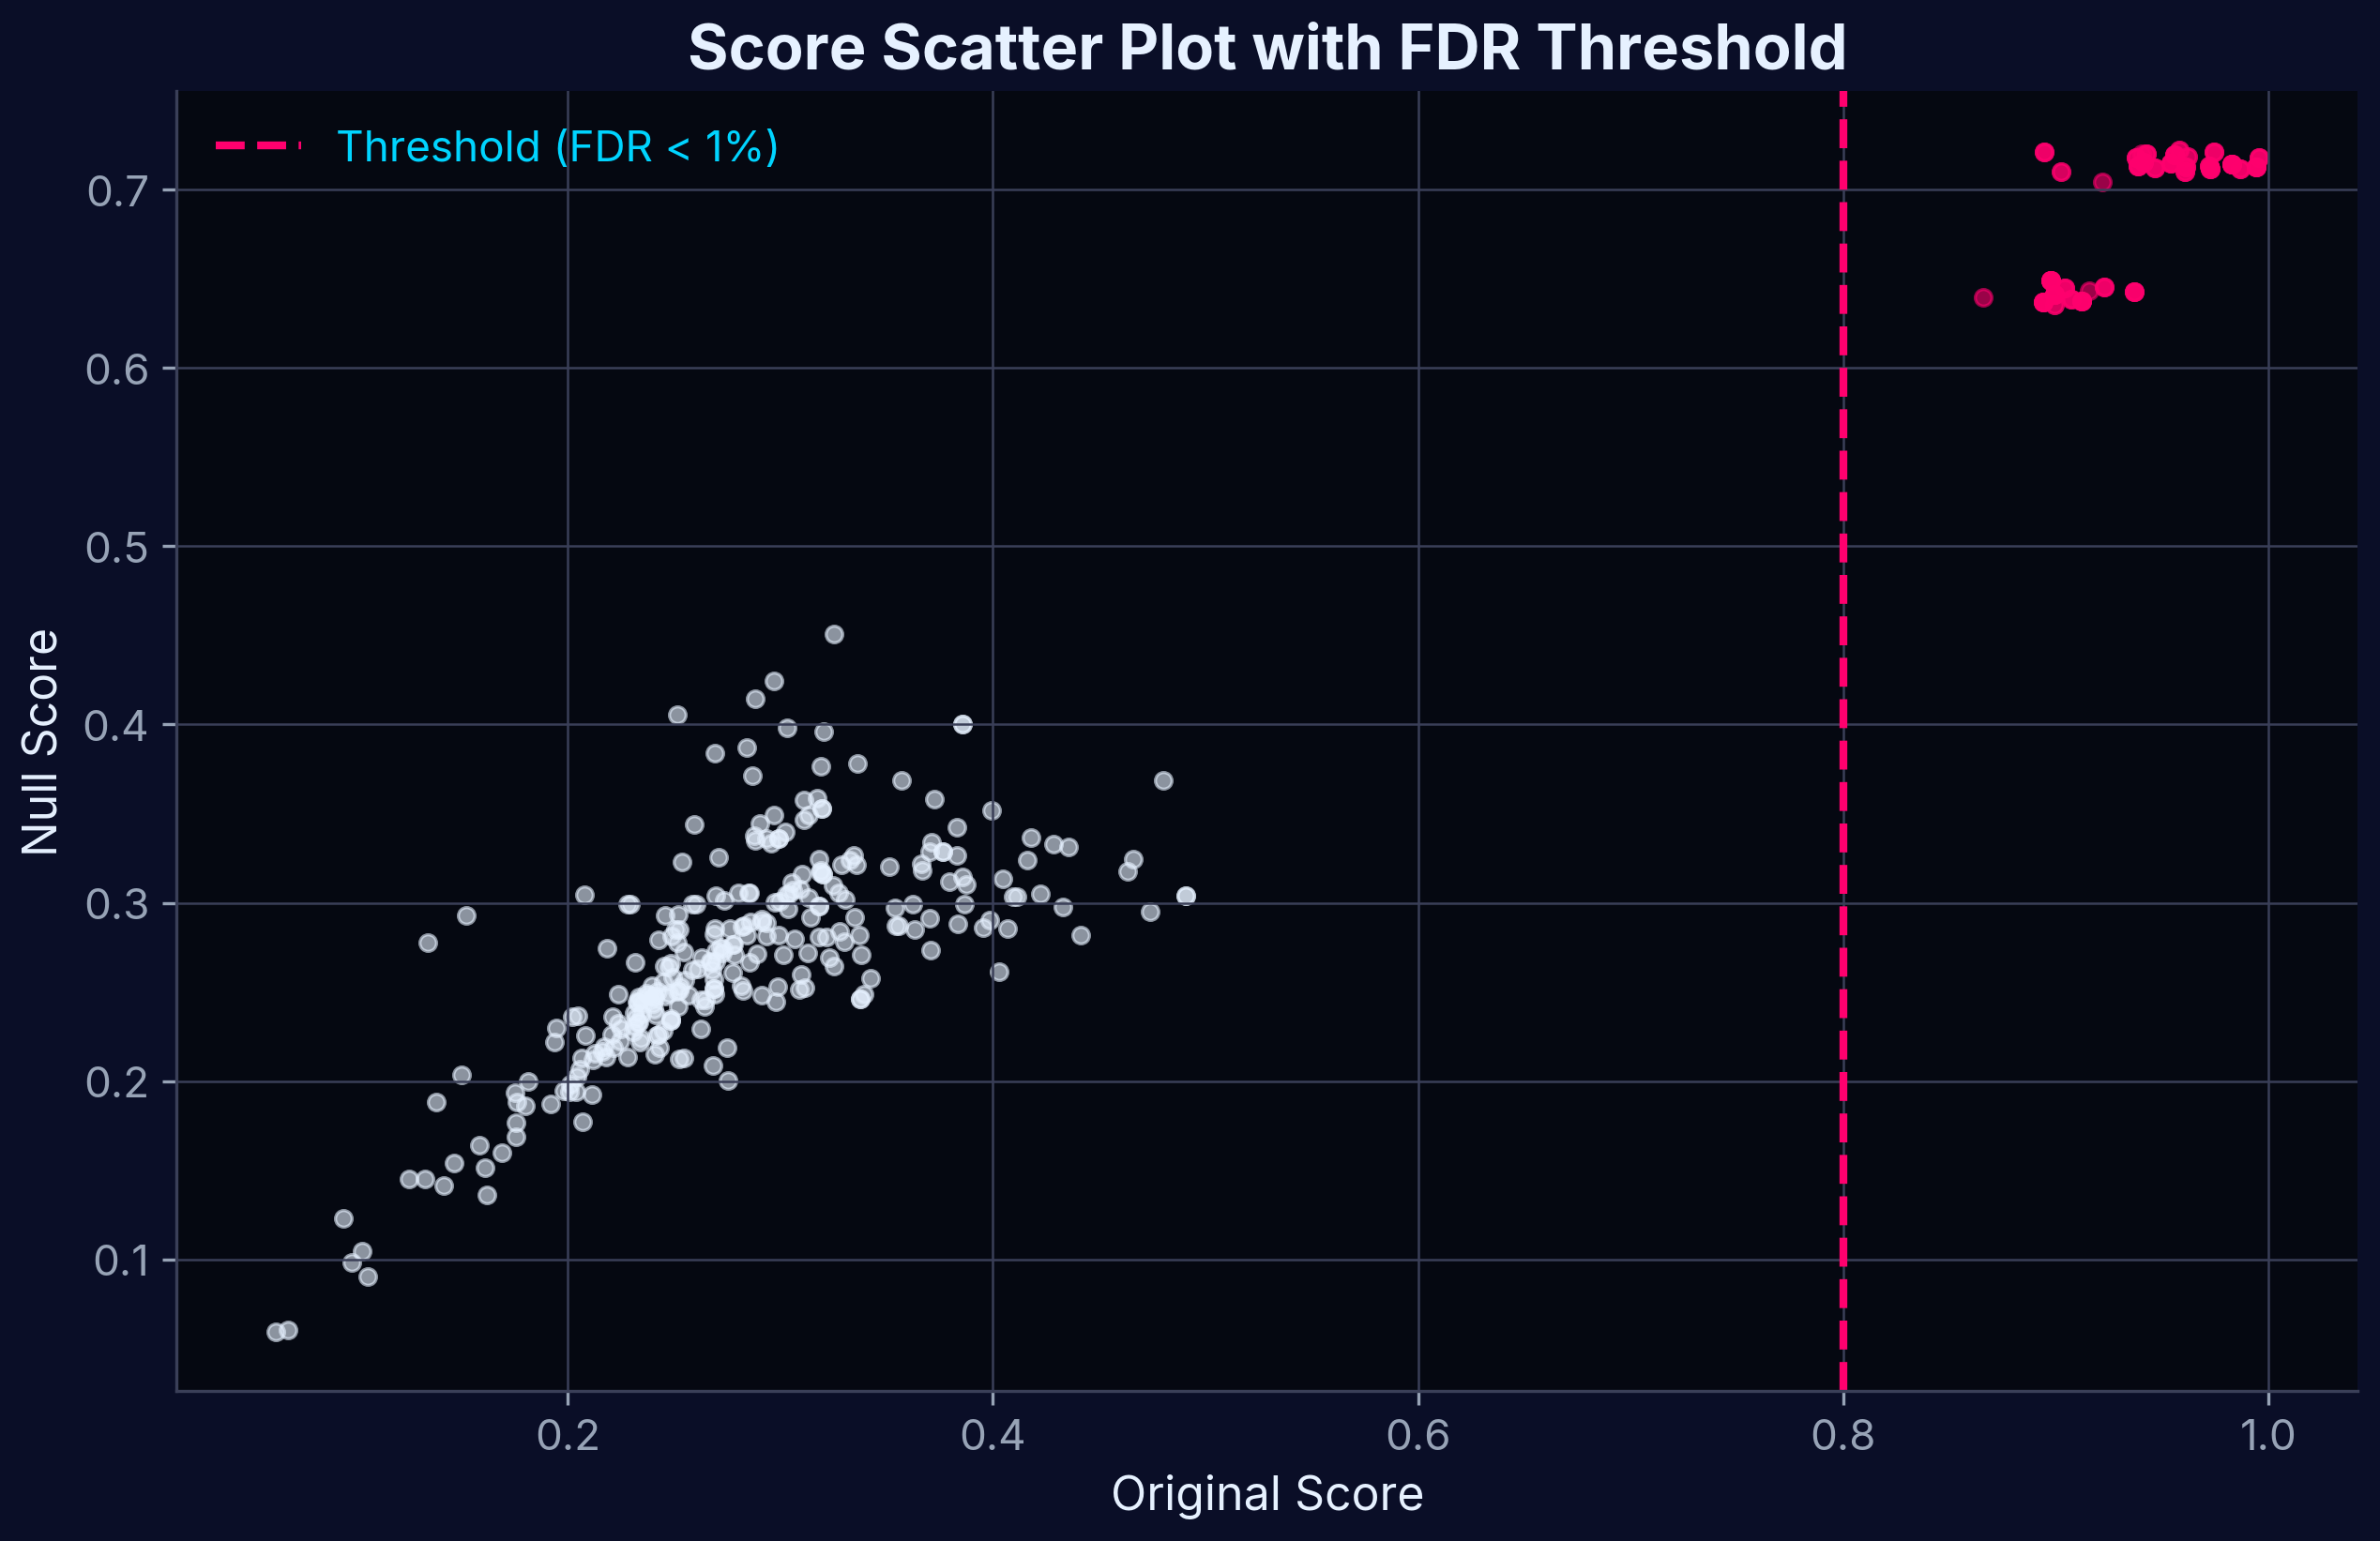
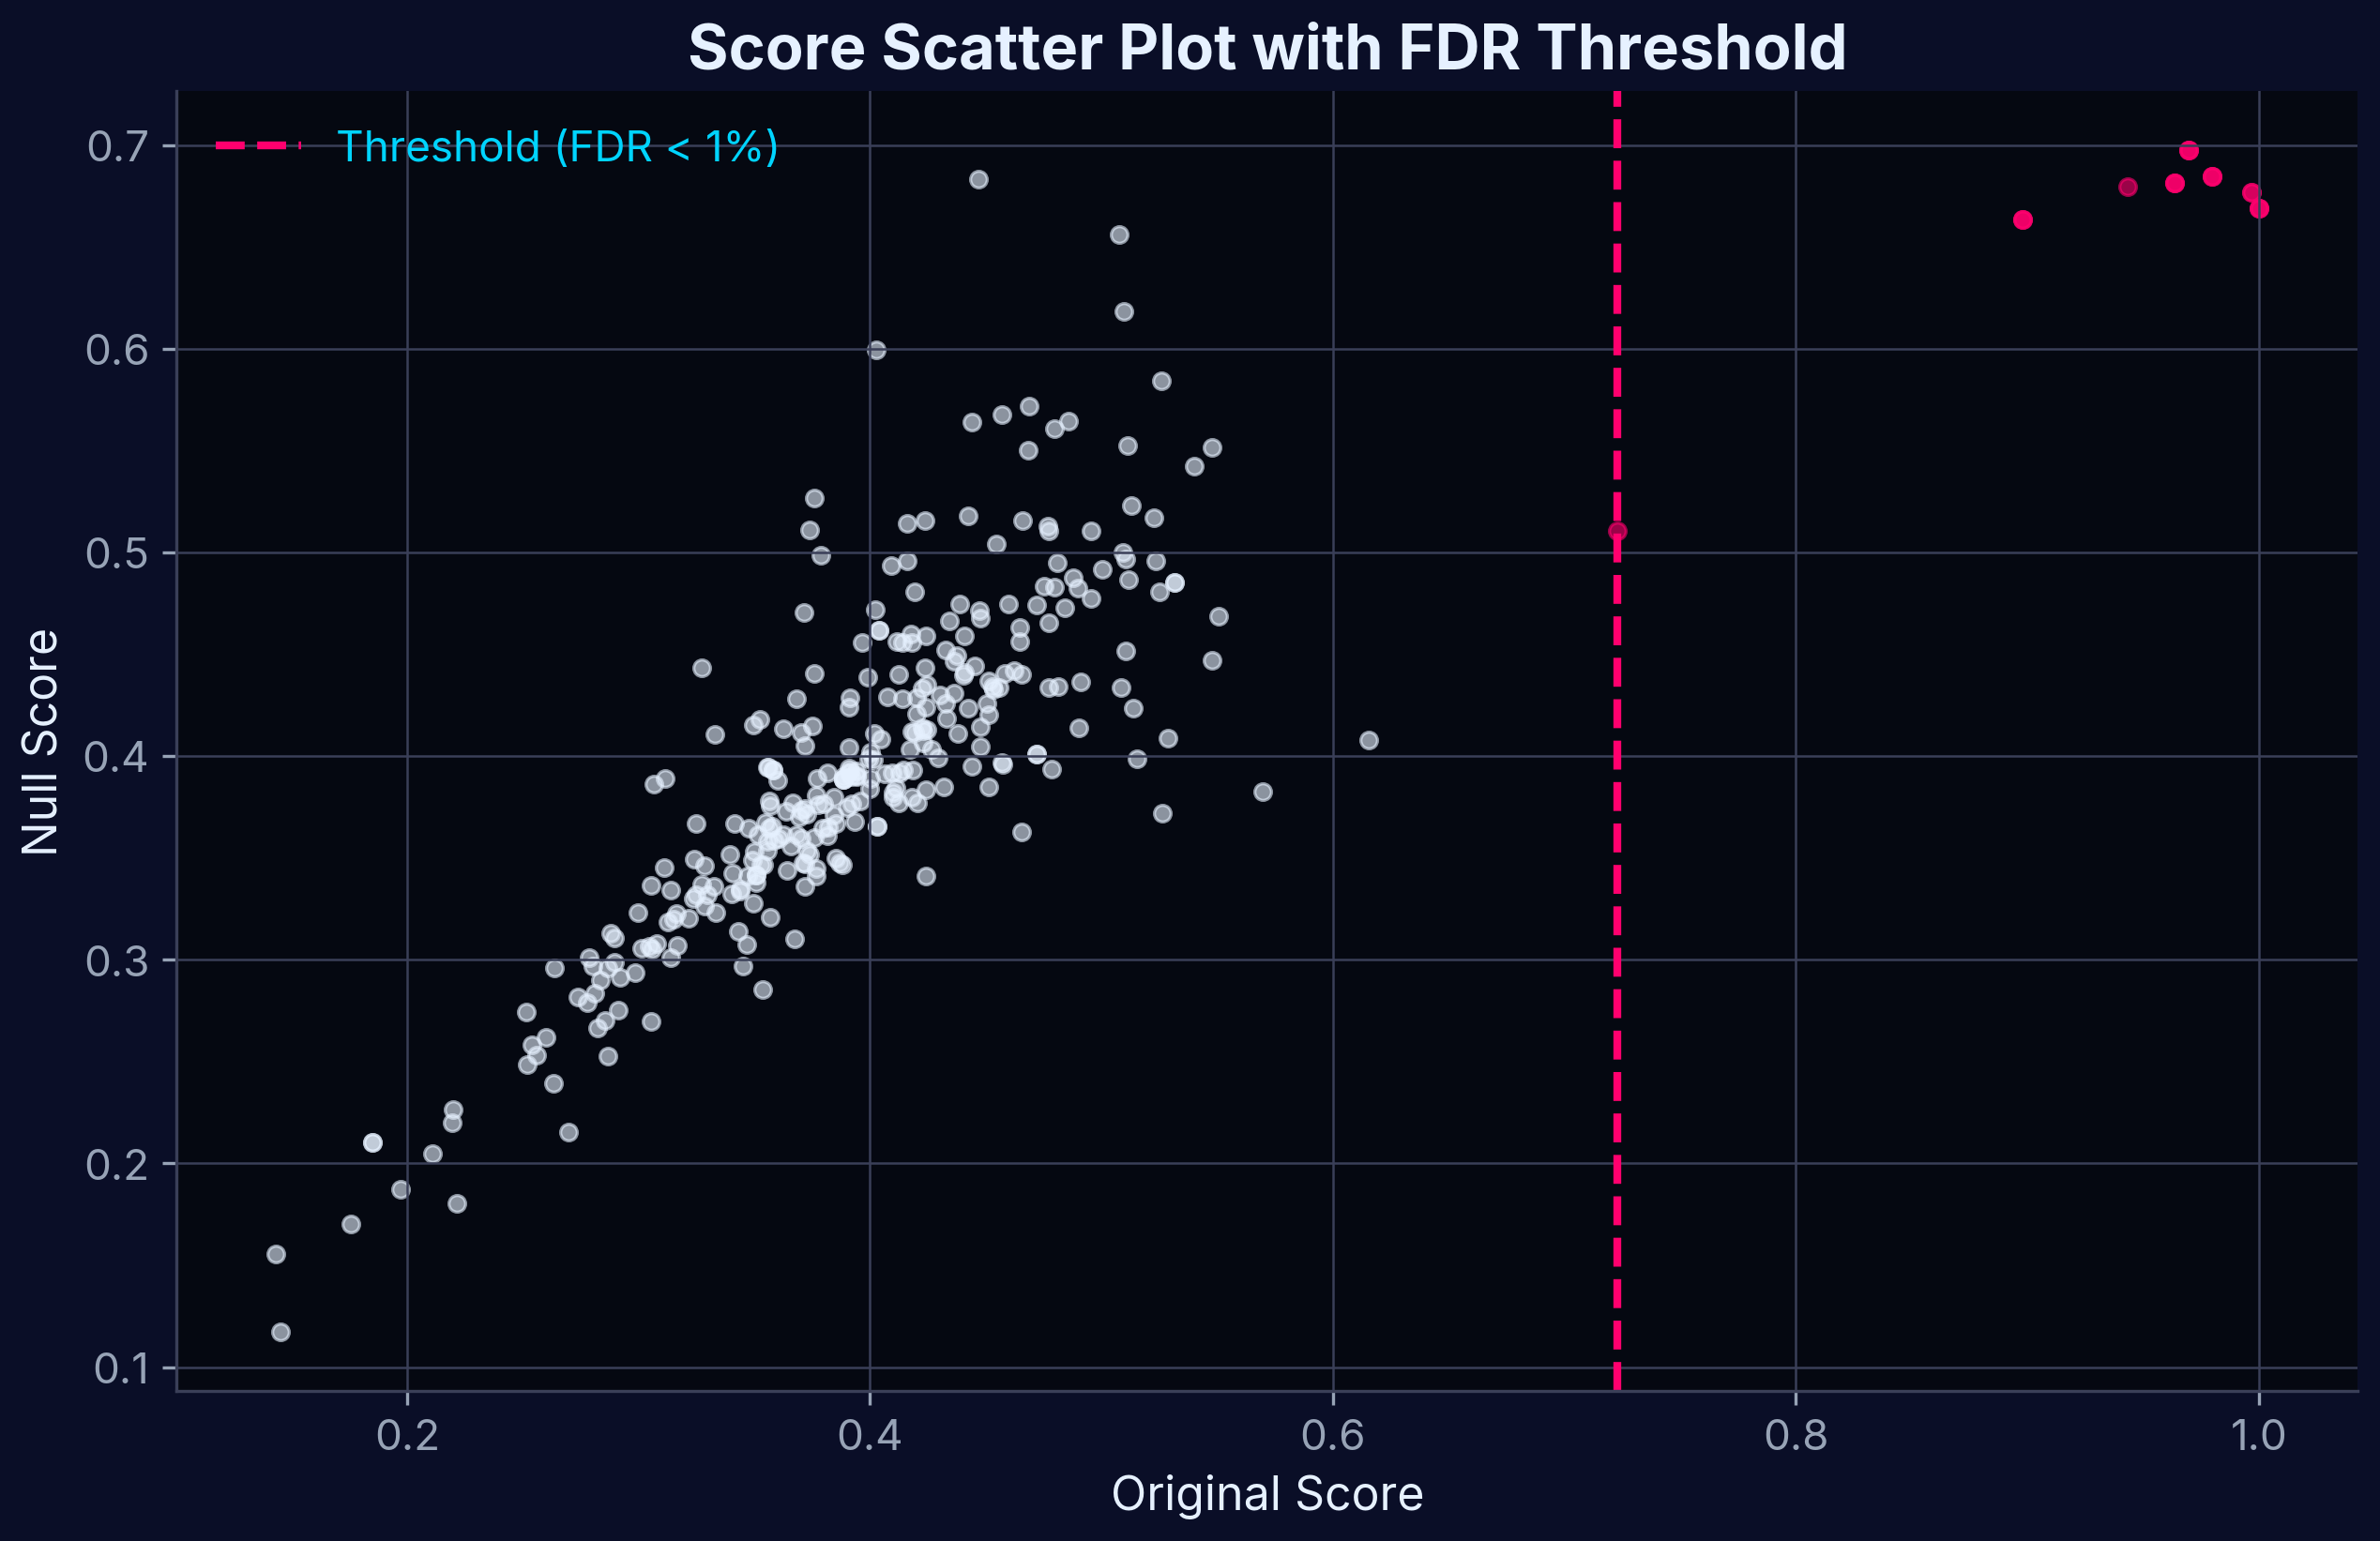
Score Scatter Plot
Scatter plot of shuffled-data–derived null scores versus Target Profiling Scores.
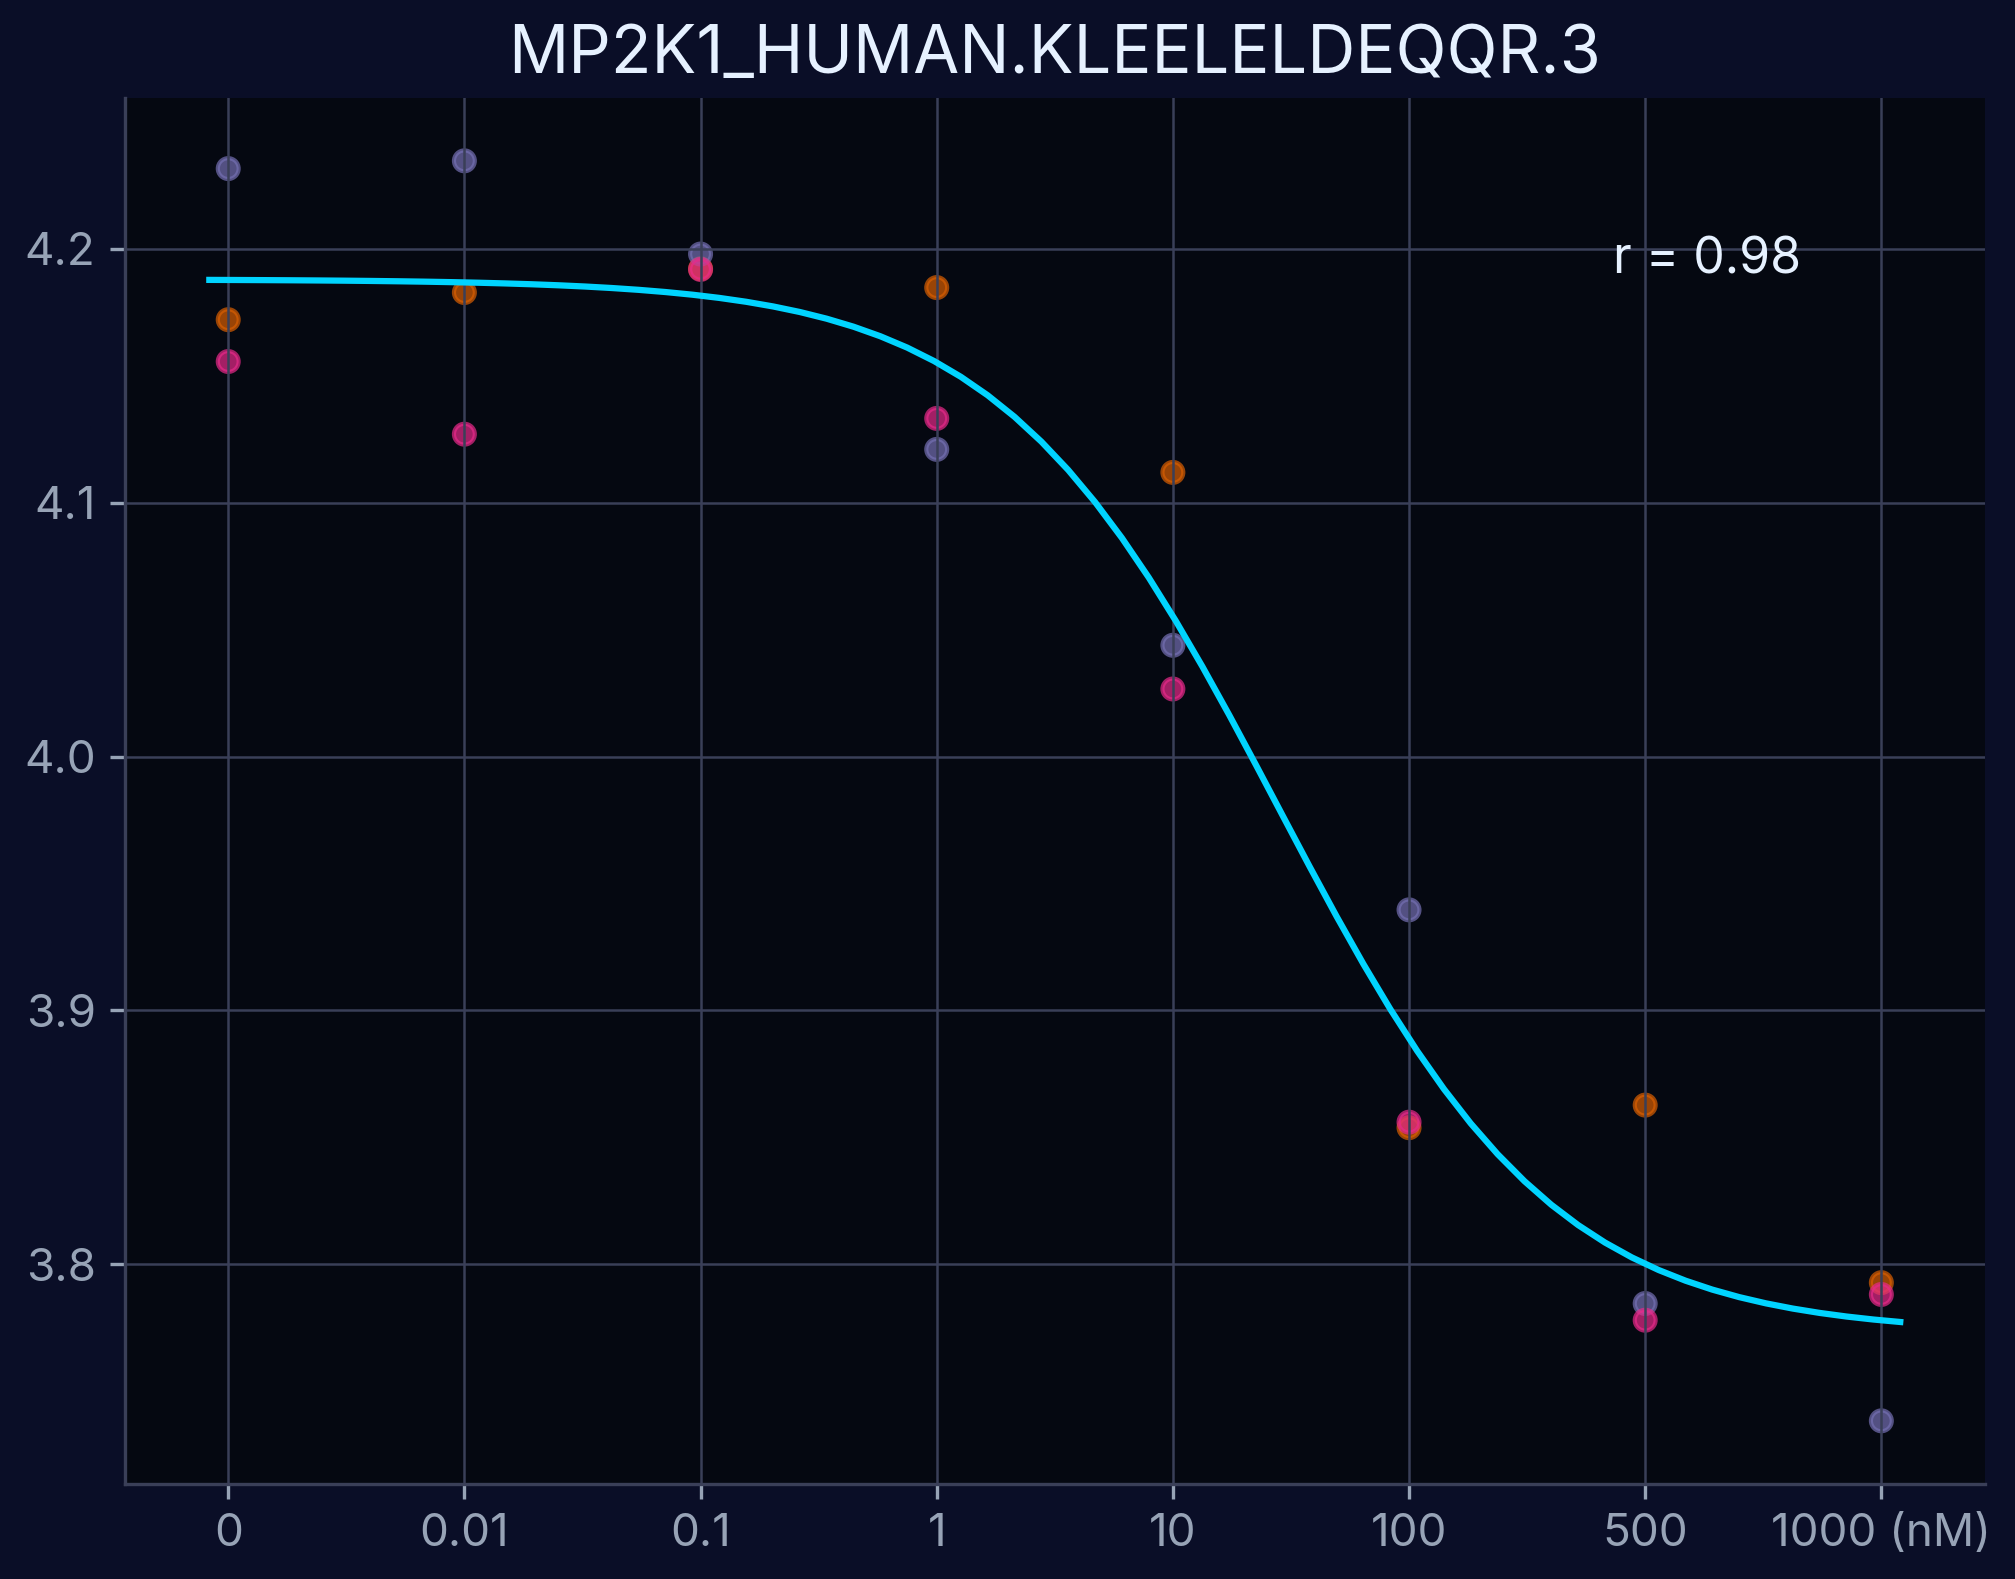
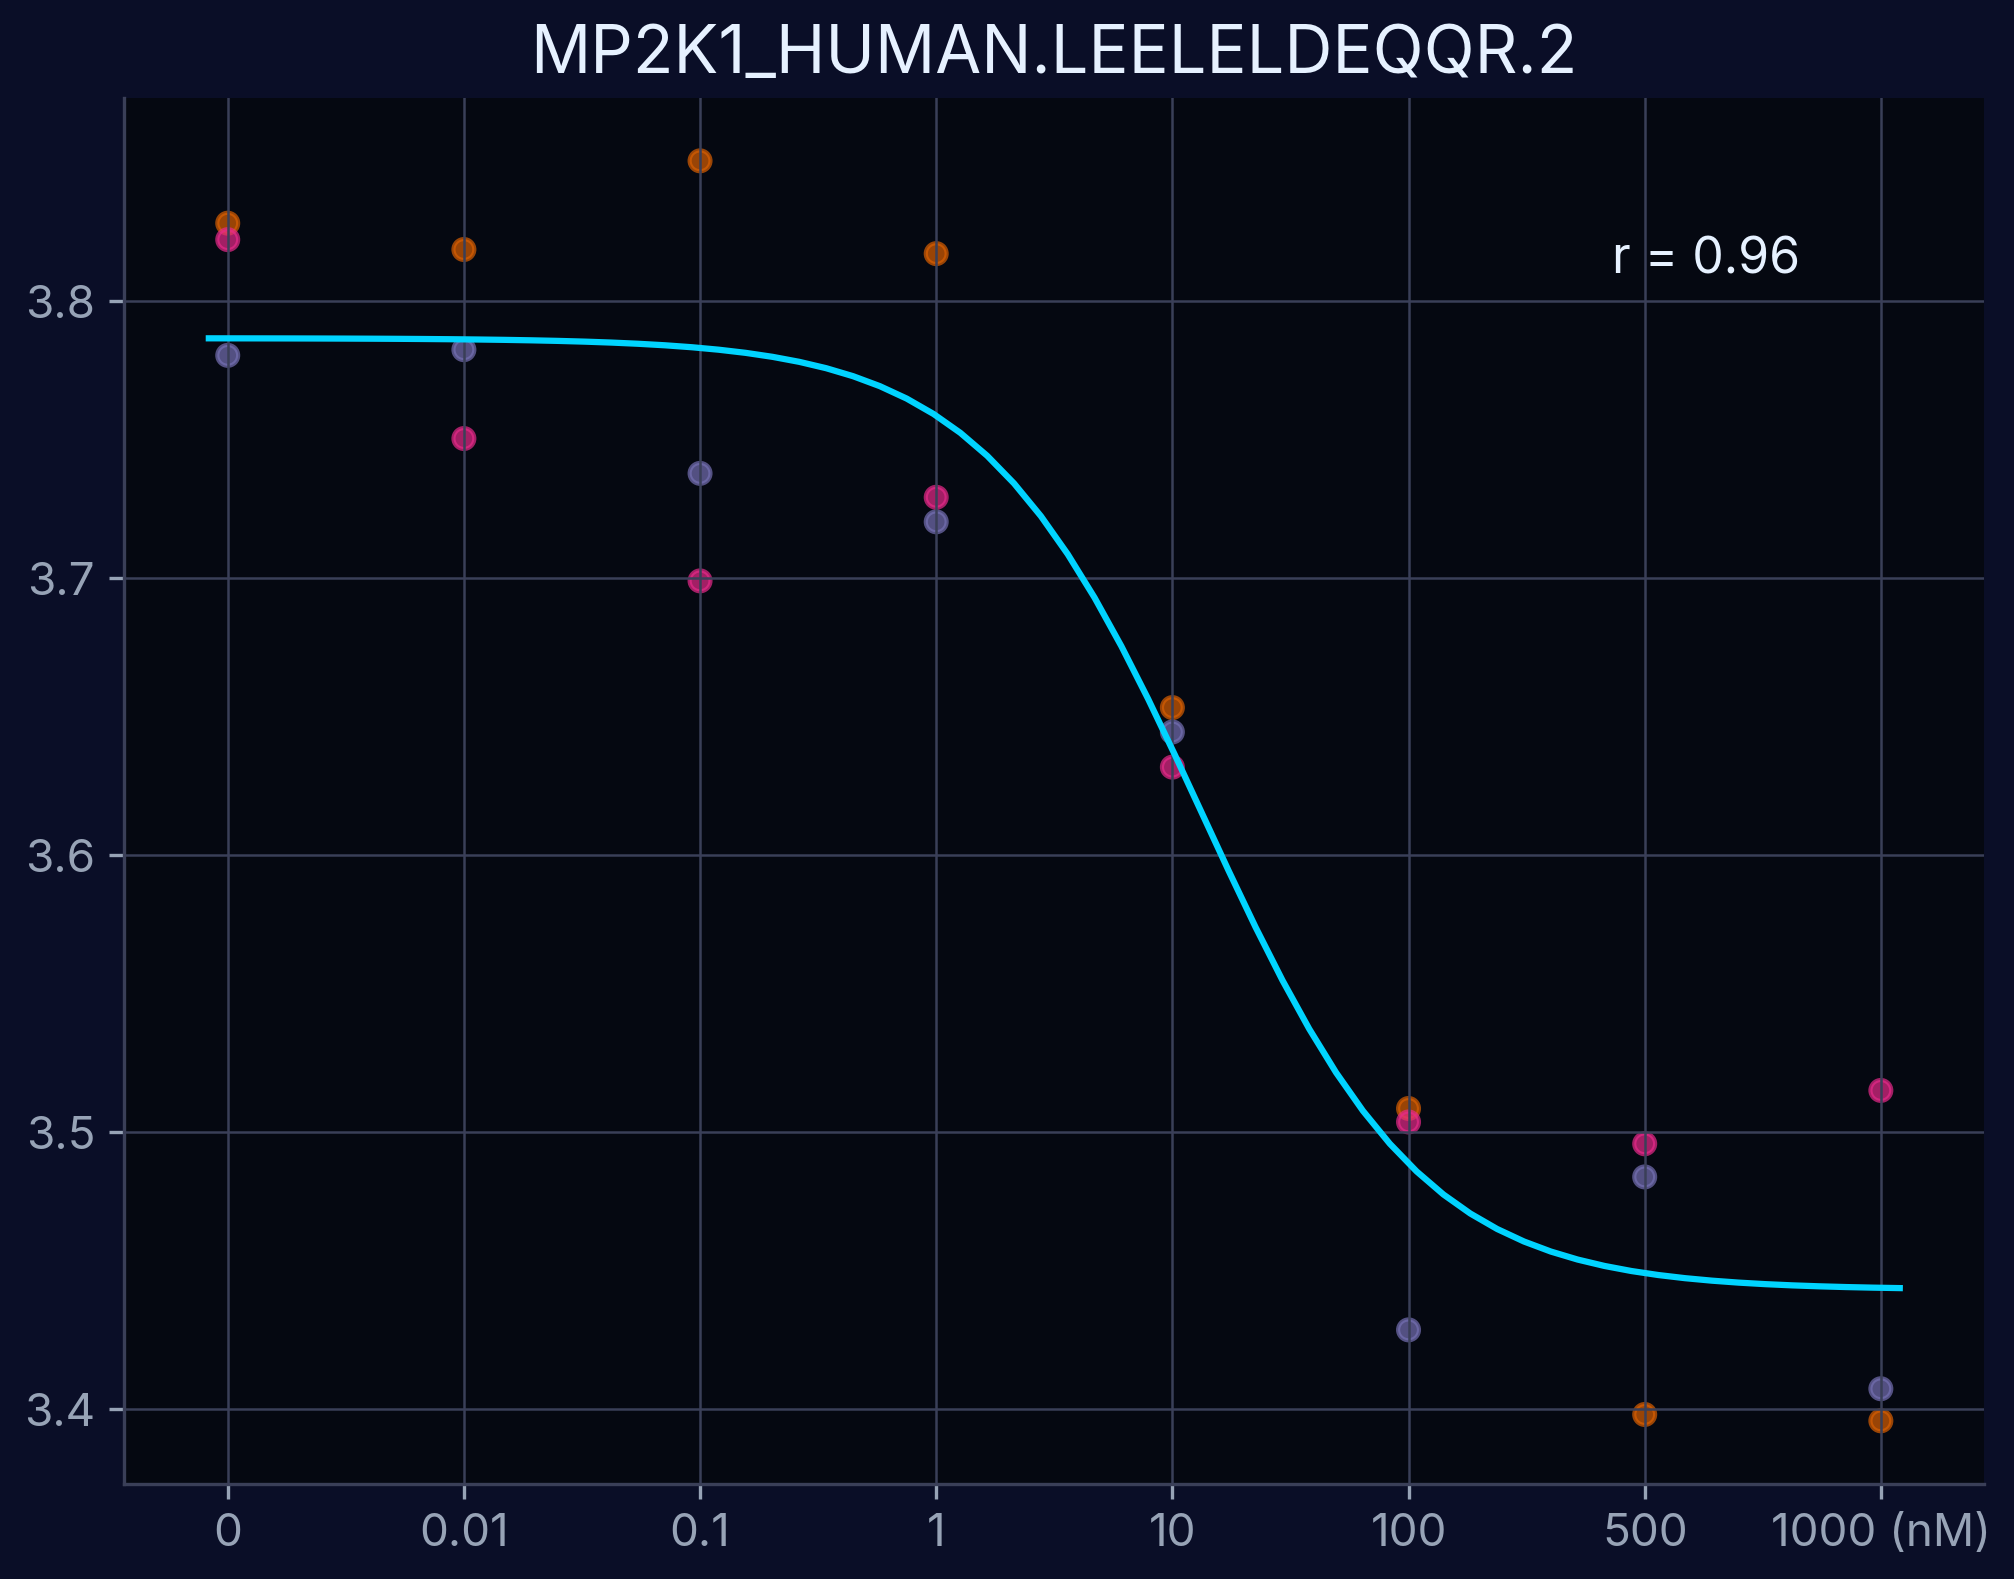
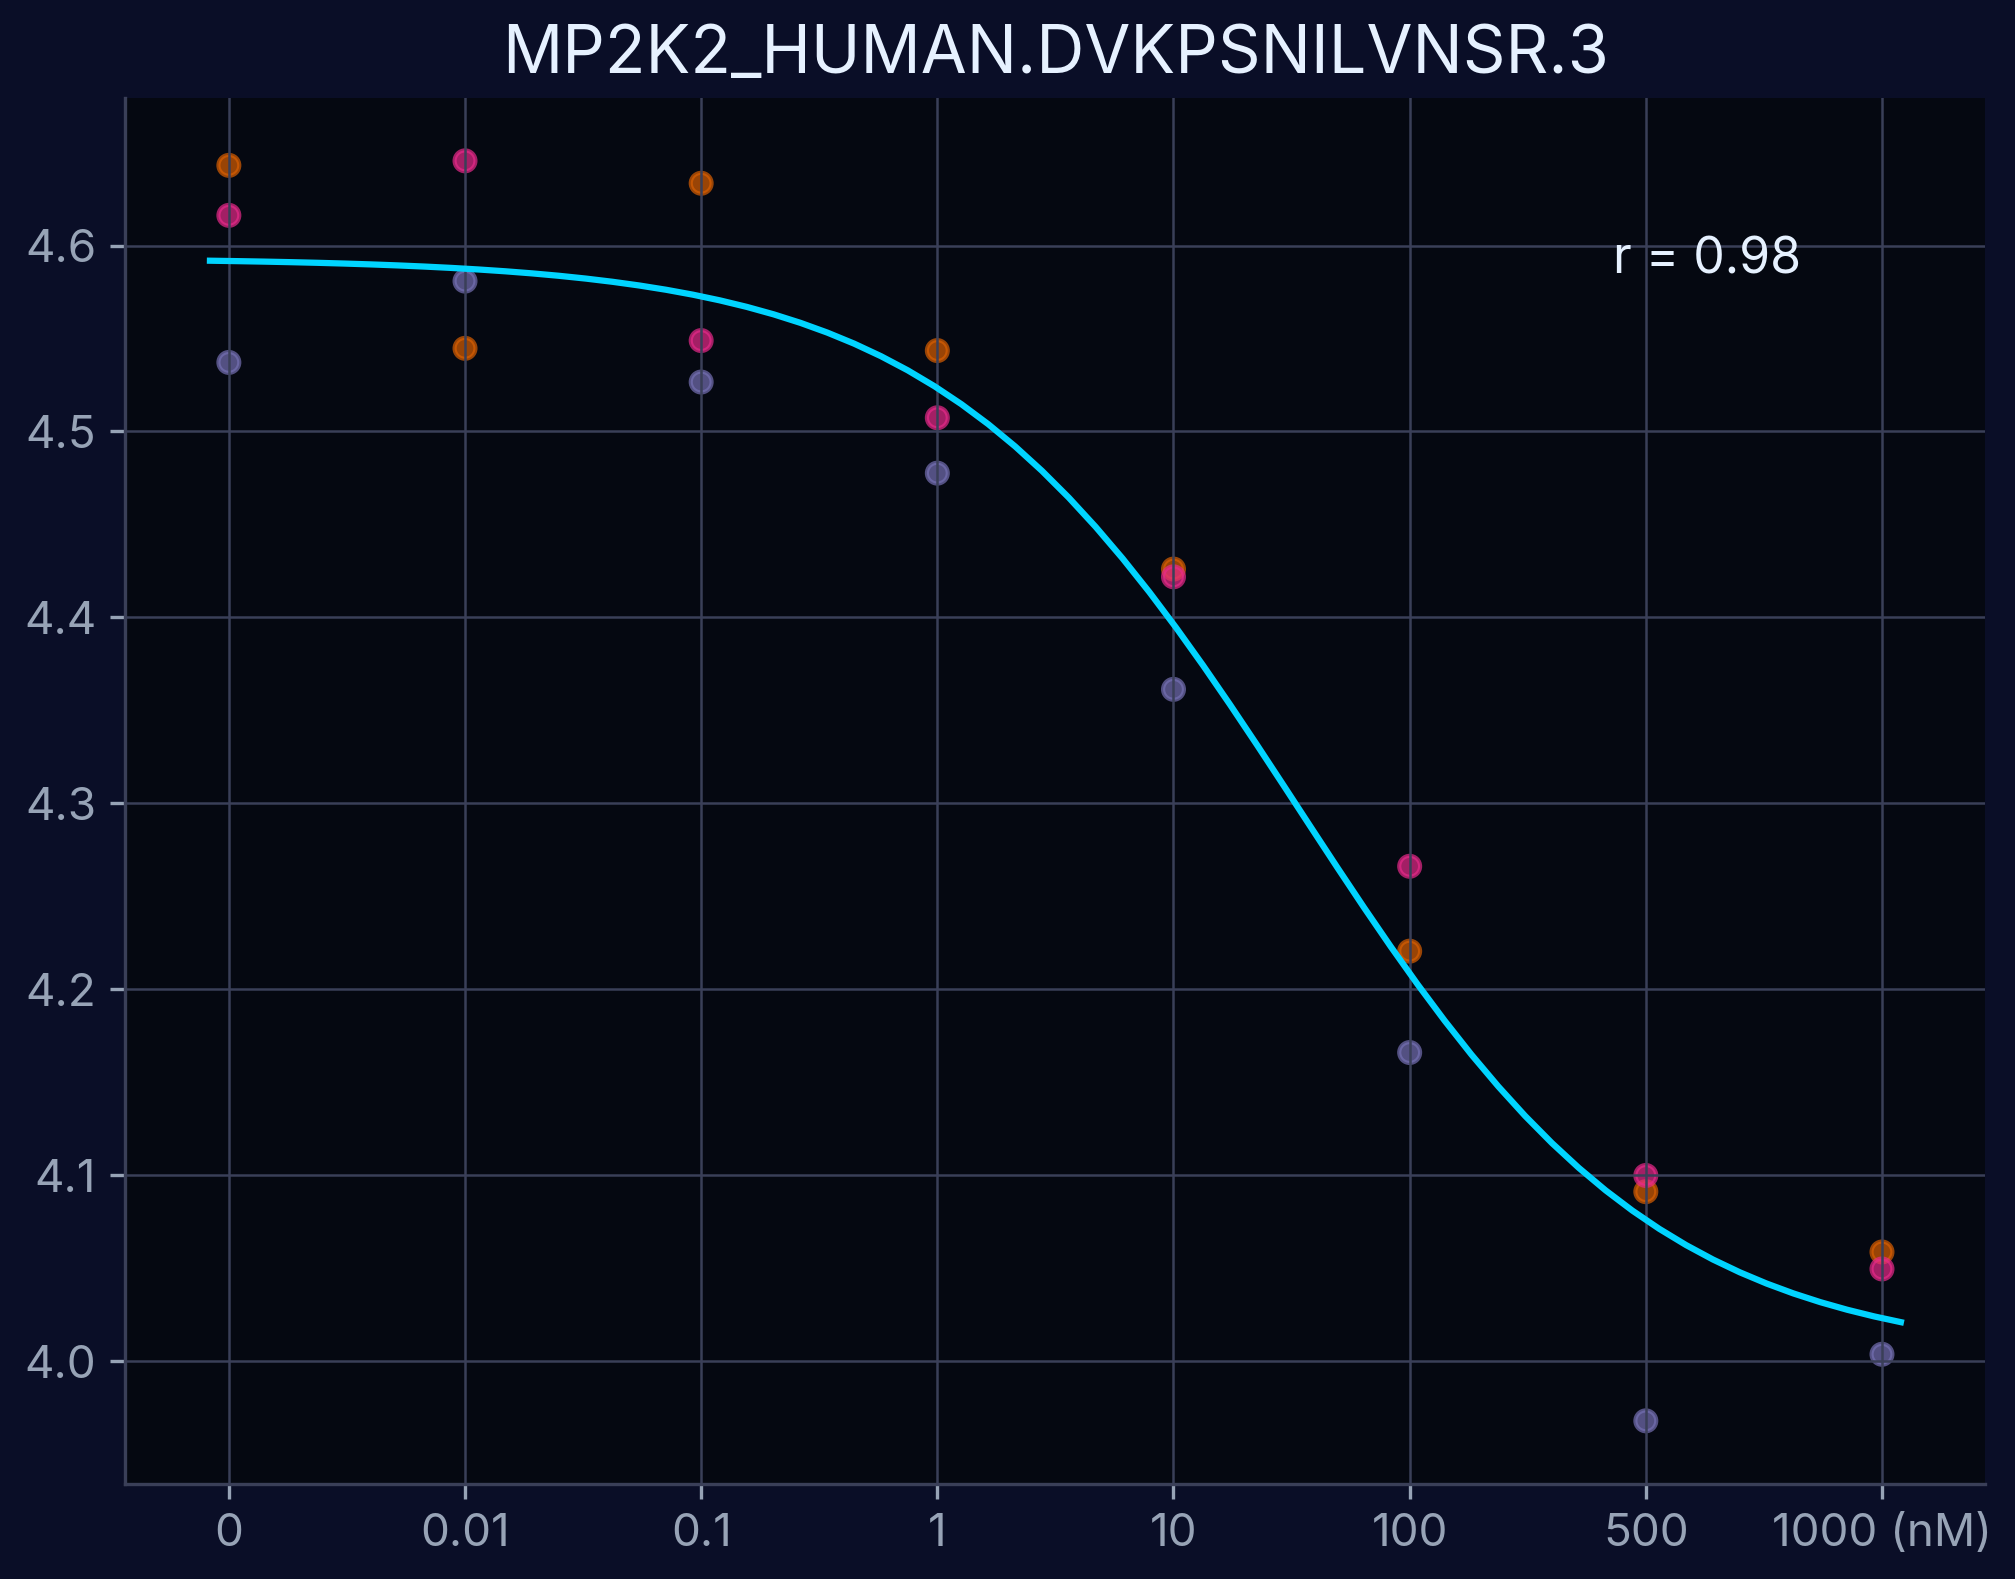
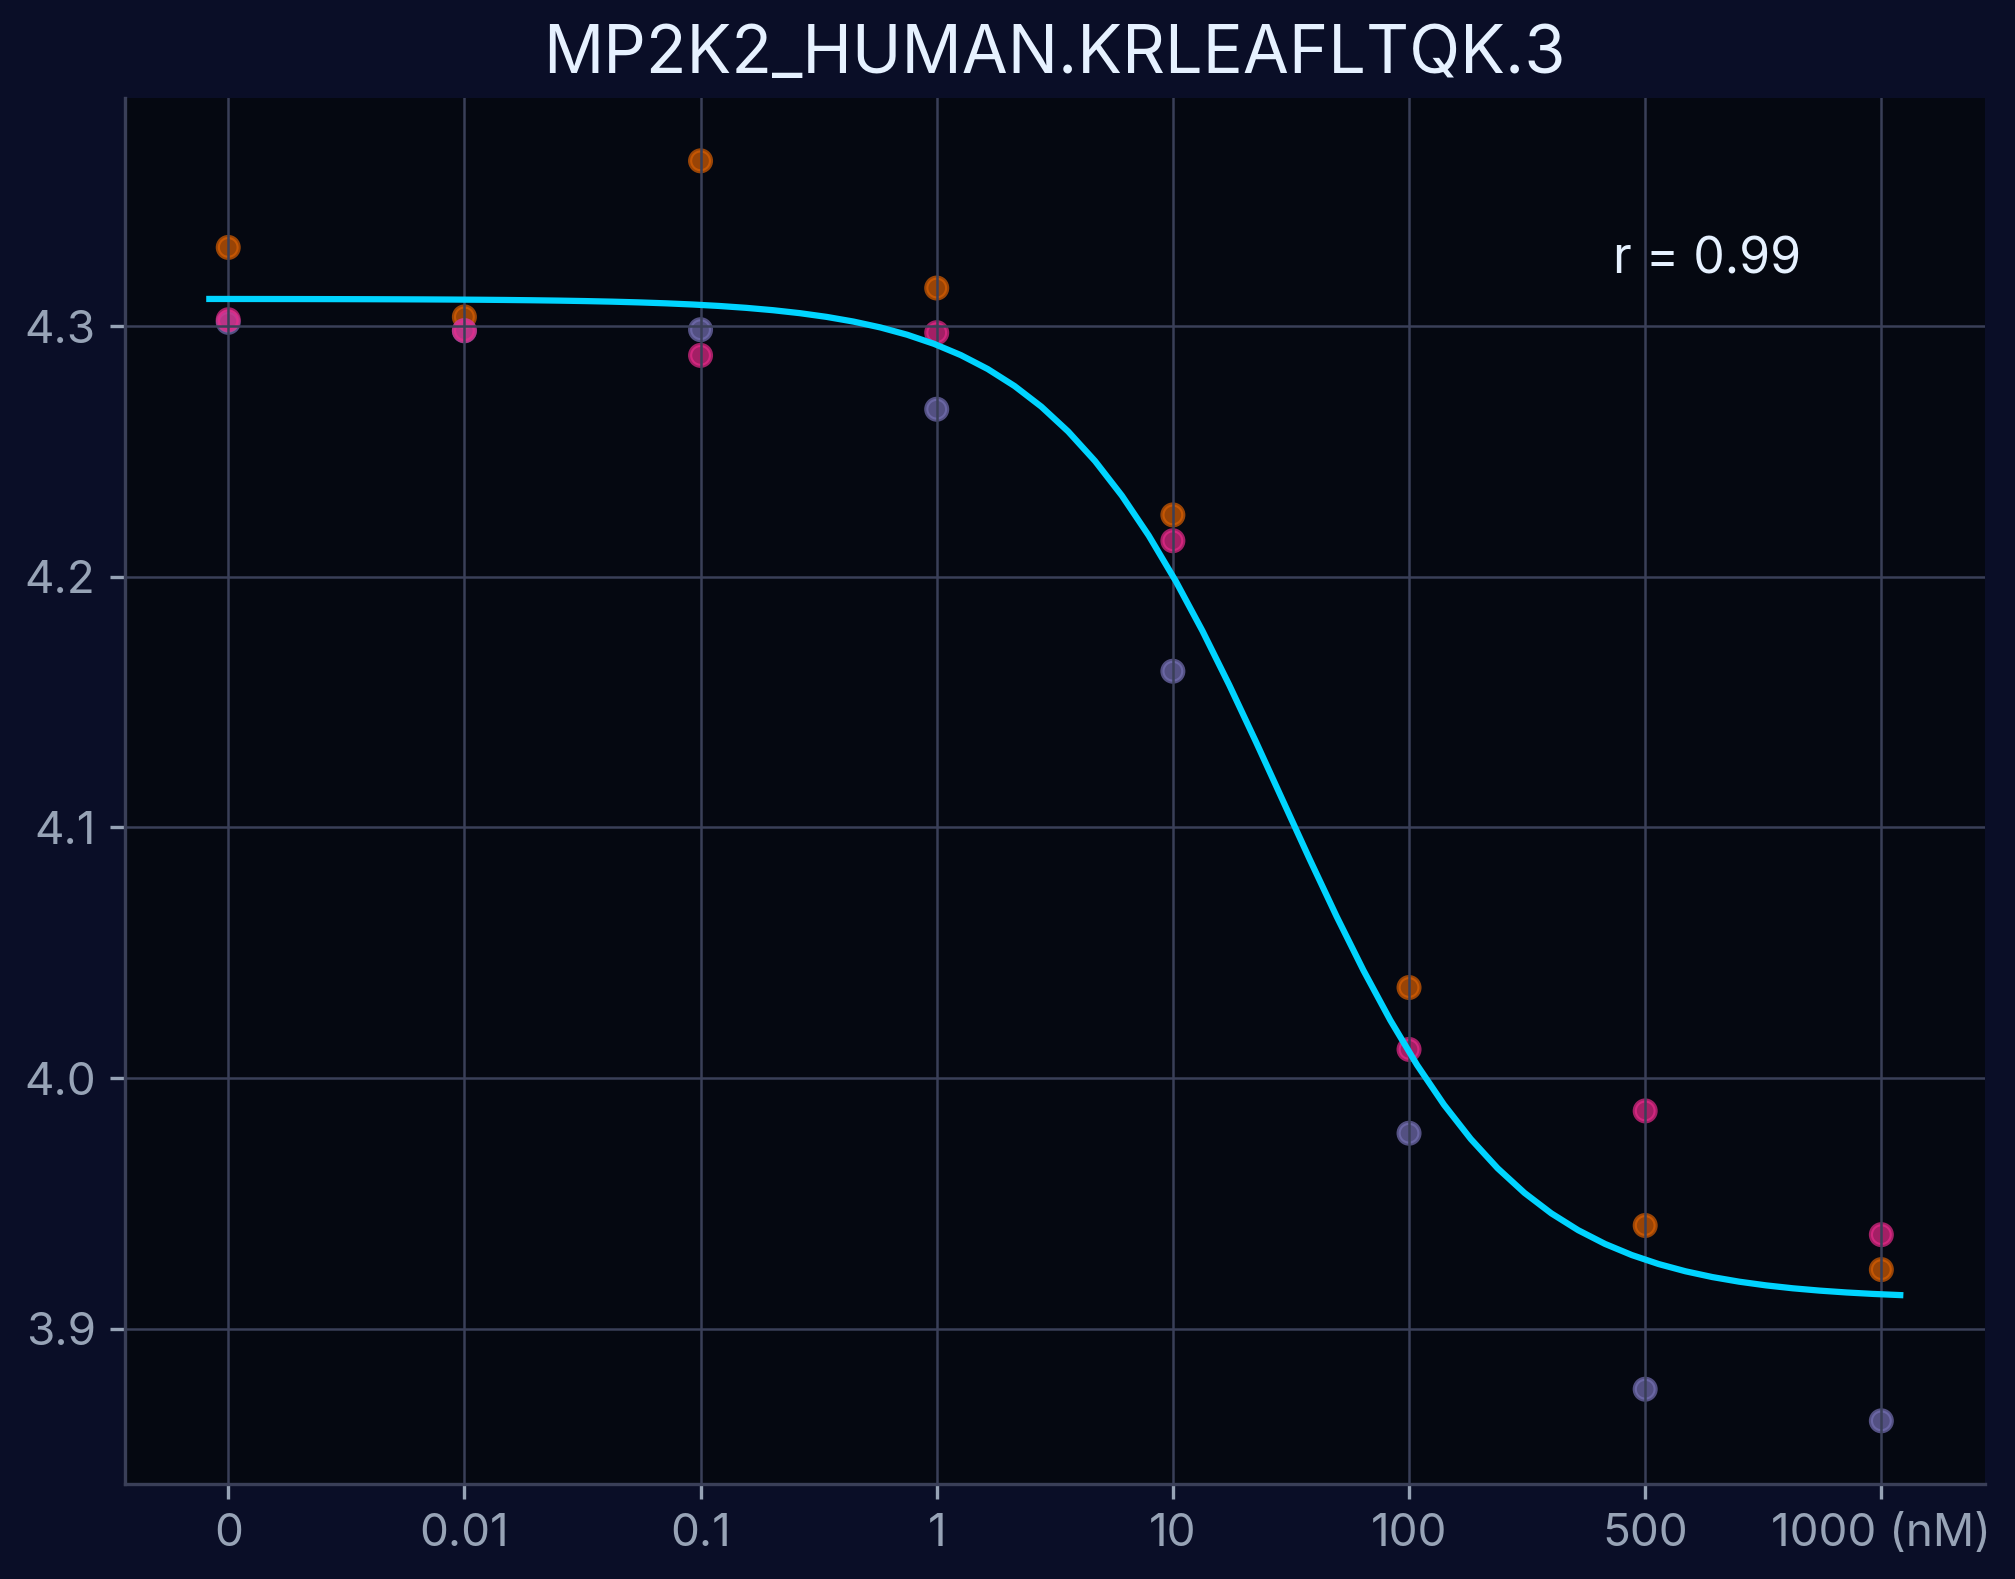
Dose-Response Curves
Dose-response curves demonstrate the relationship between compound concentration and proteolytic resistance. Each curve represents an individual peptide derived from the target protein, showing dose-dependent proteolytic resistance upon compound binding.
MAP2K1 - KLEELELDEQQR
MAP2K1 - LEELELDEQQR
MAP2K2 - DVKPSNILVNSR
MAP2K2 - KRLEAFLTQK
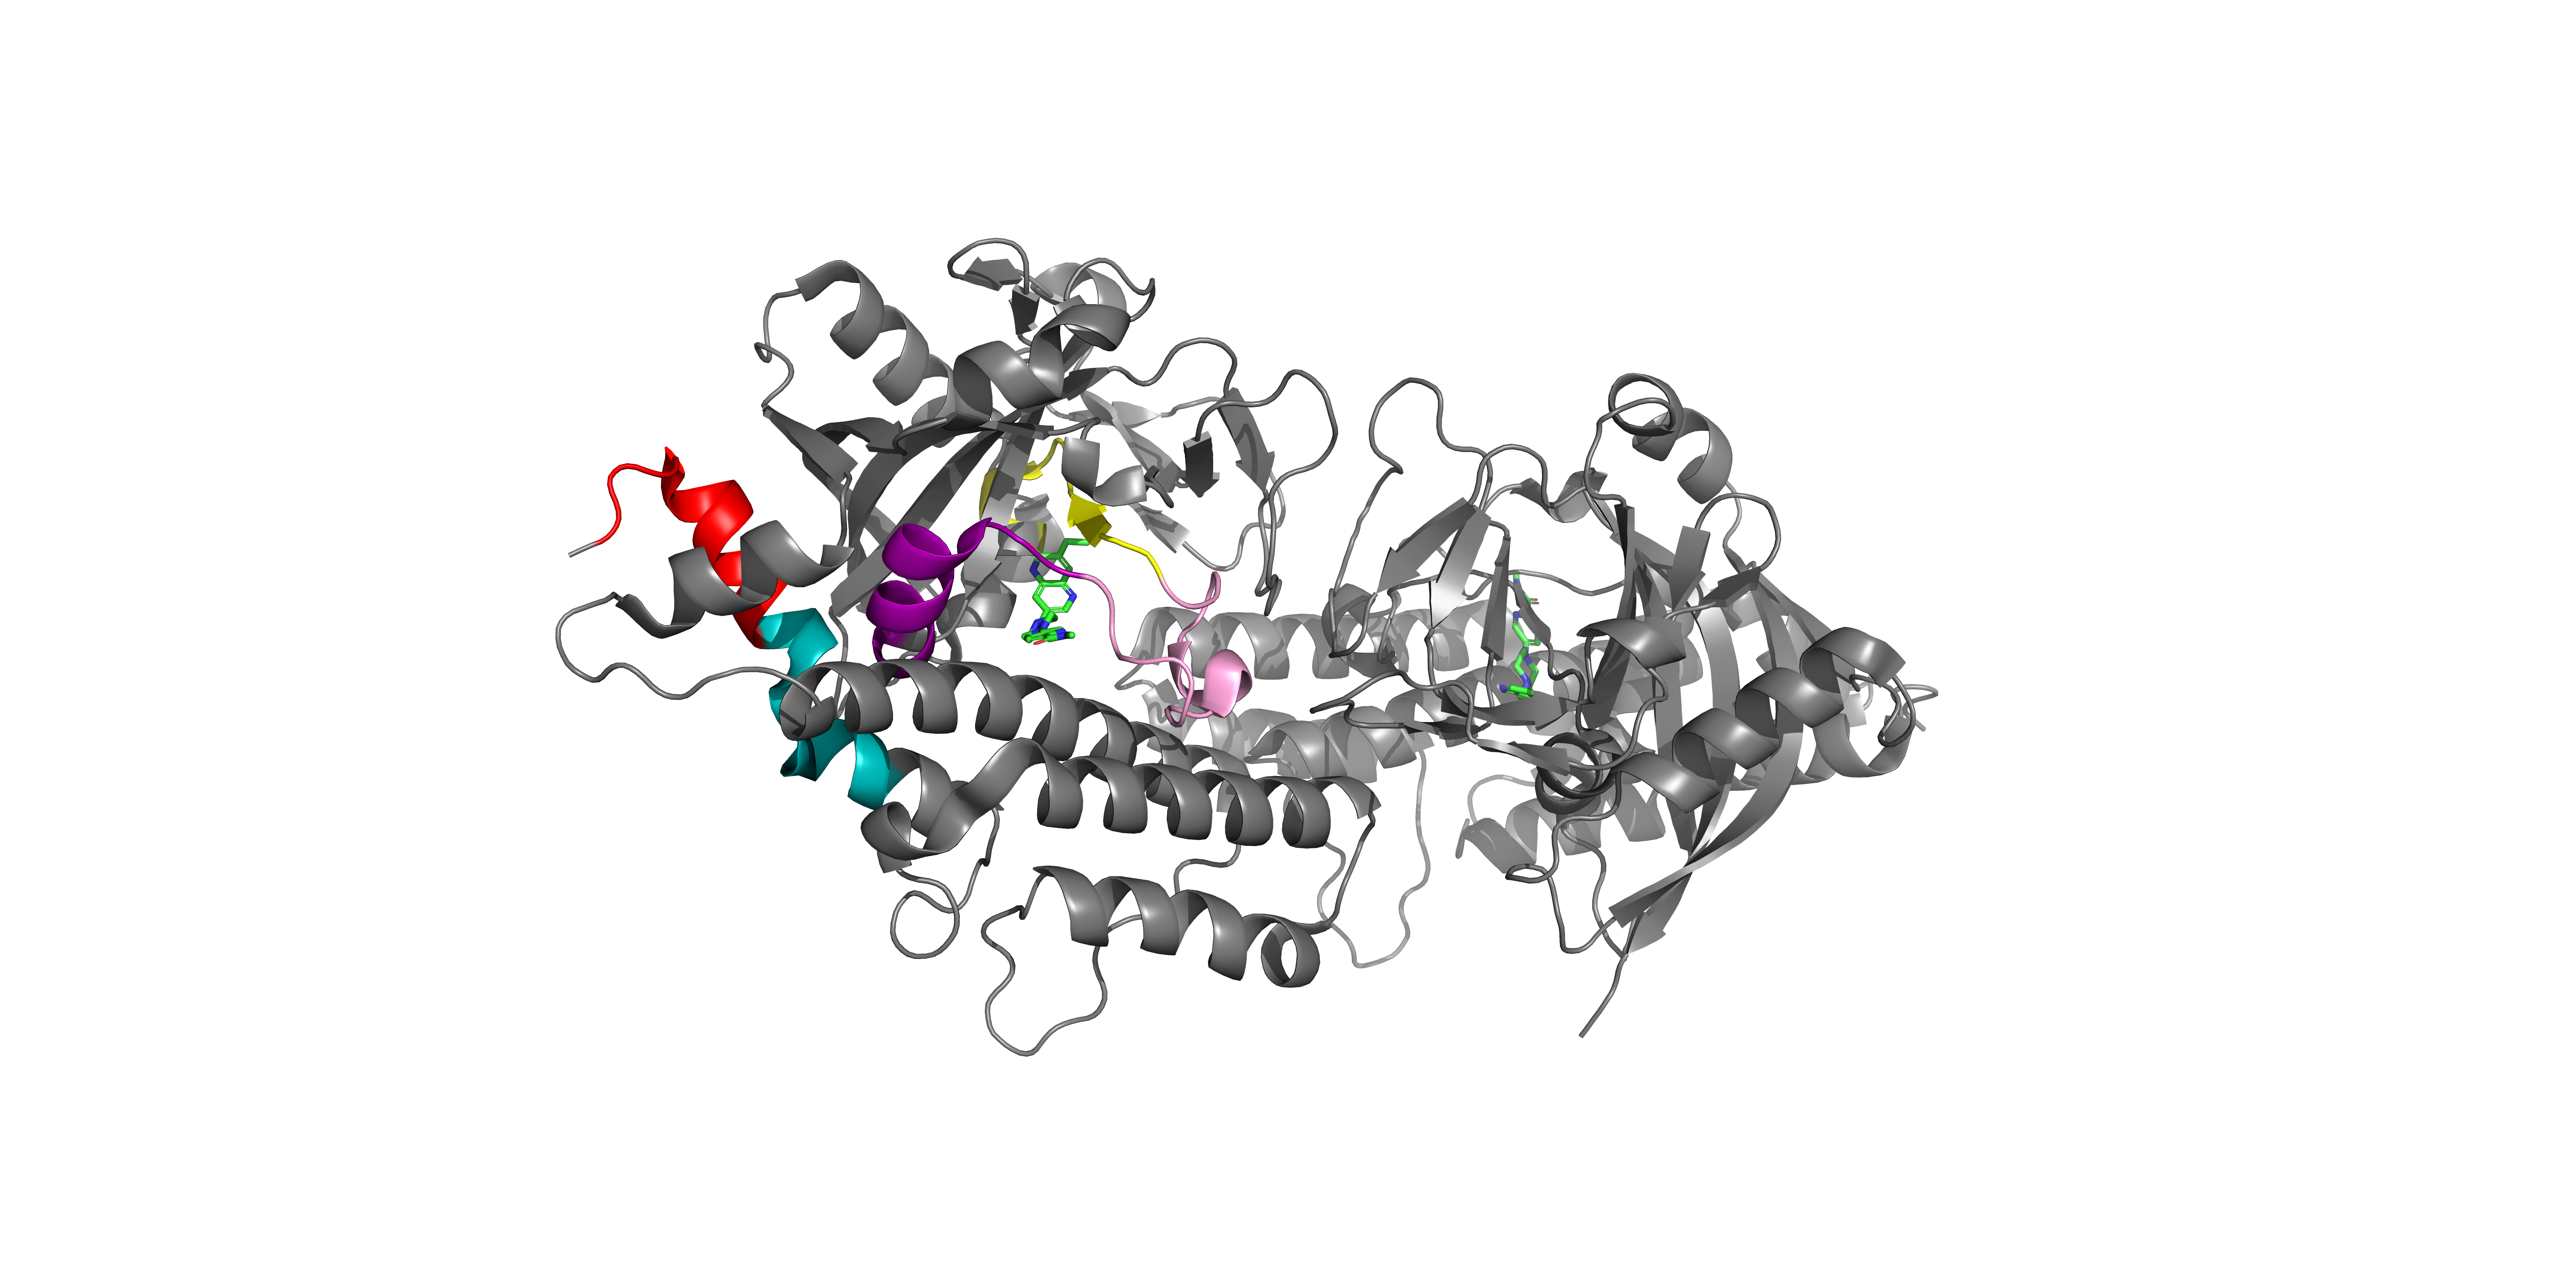
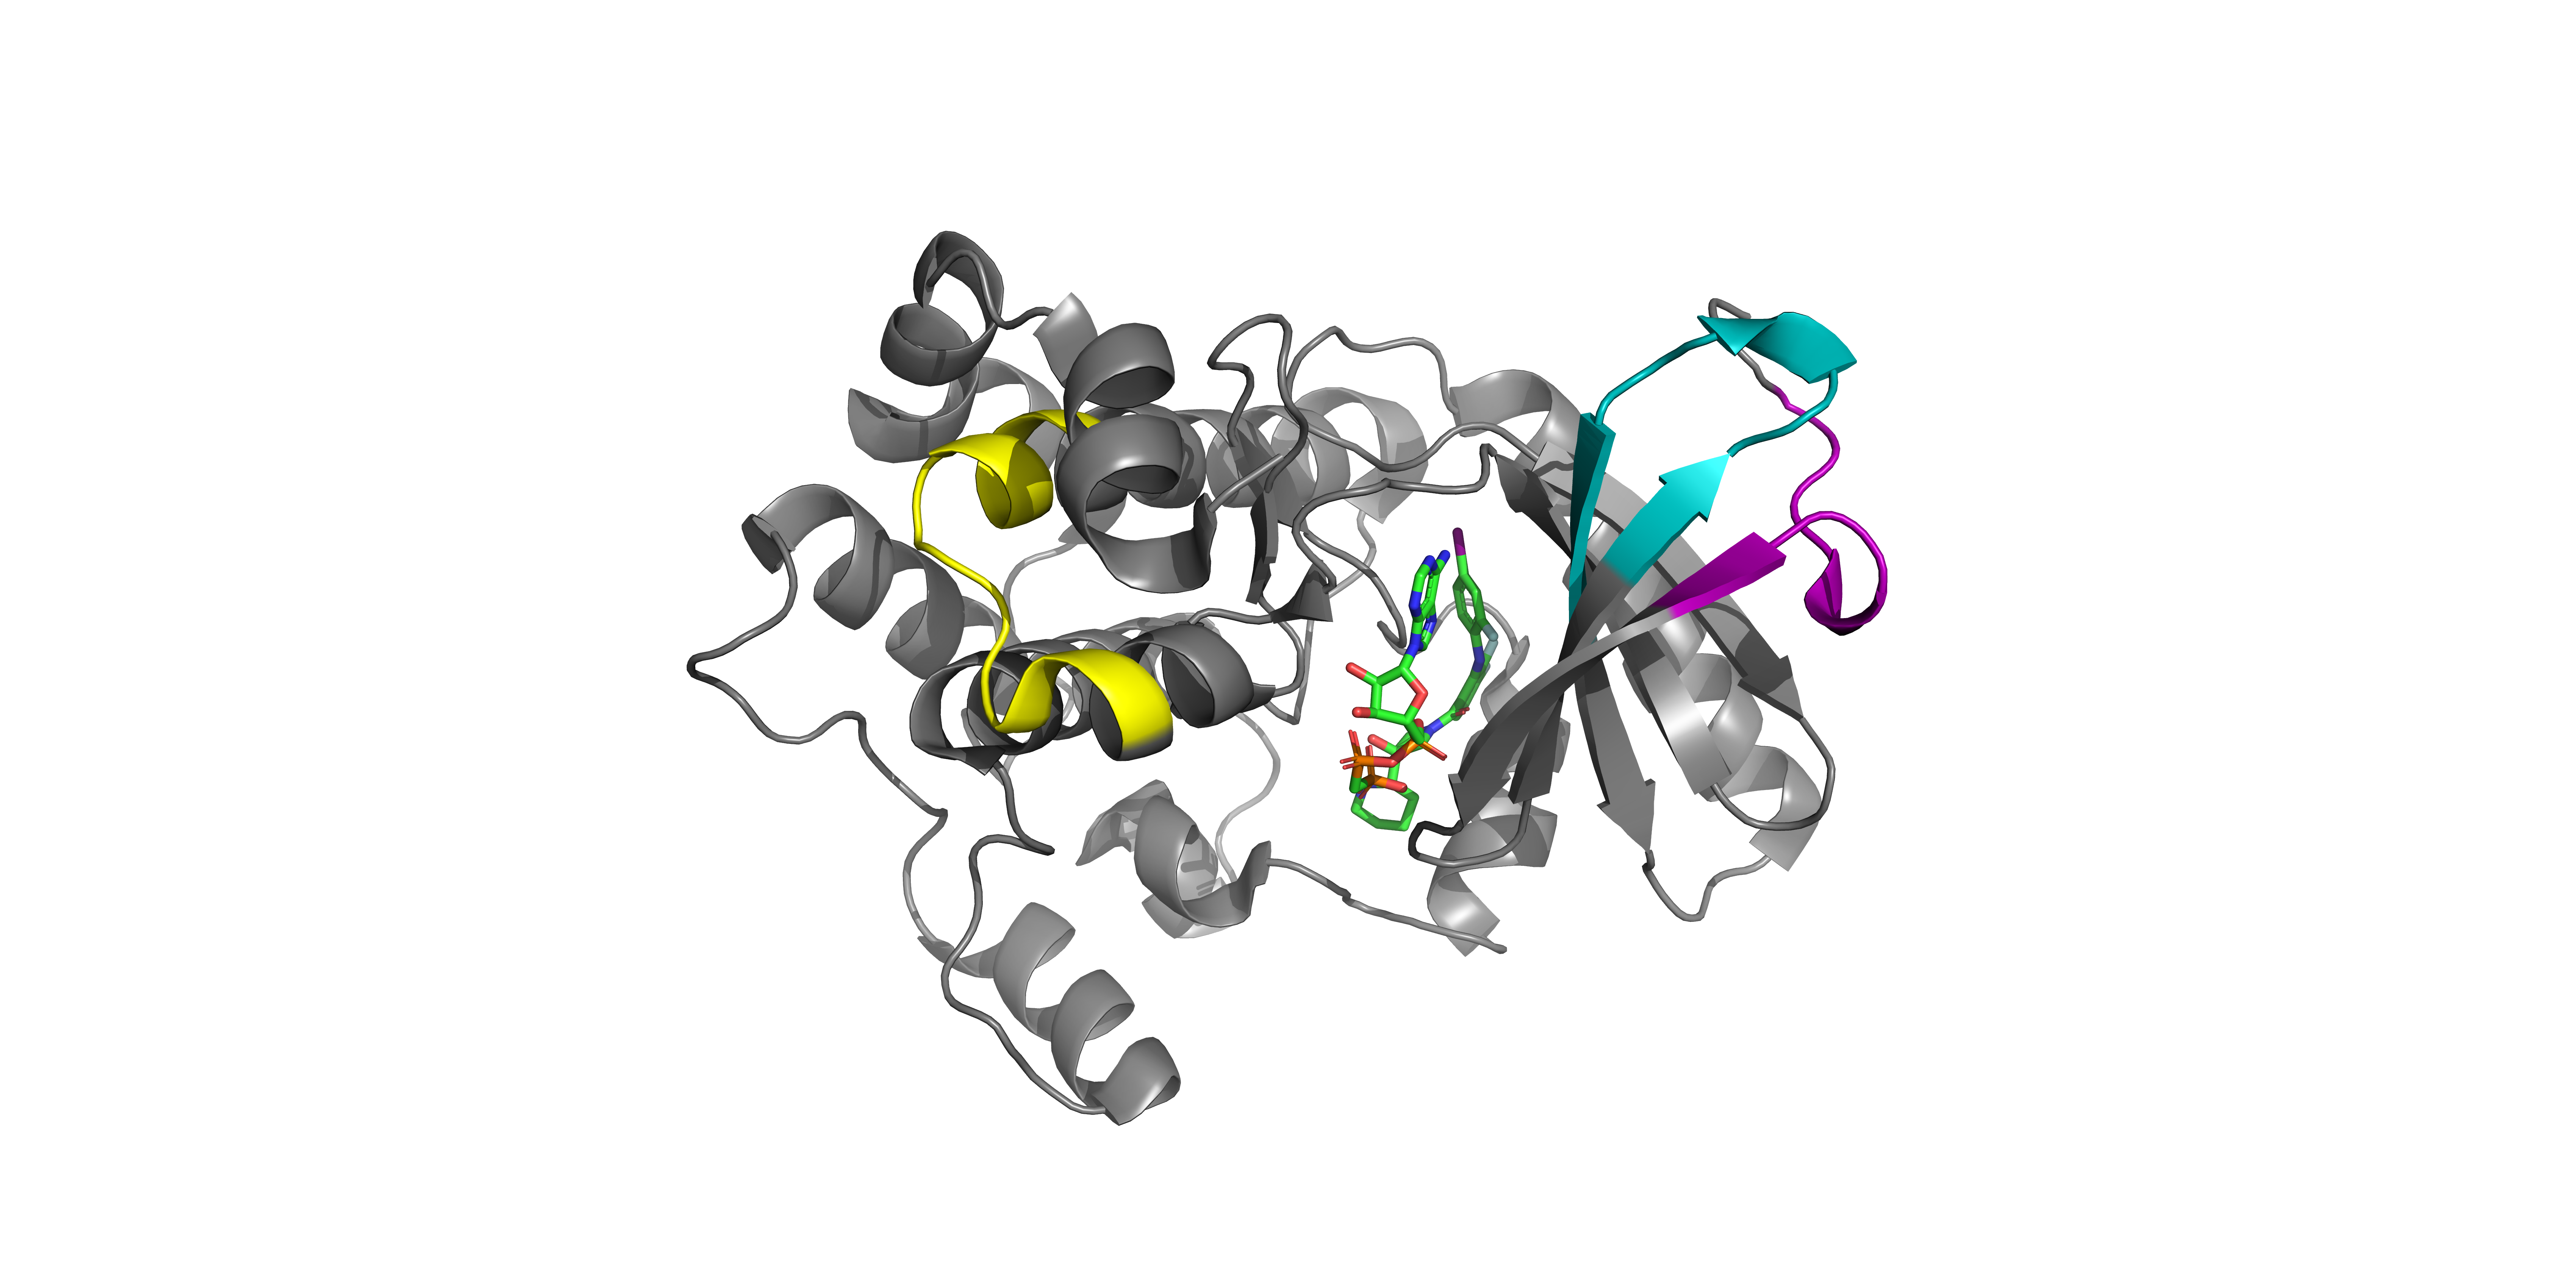
Target Protein Structure
MAP2K1 3D Structure with Identified Peptides
Three-dimensional structure of MAP2K1 showing the spatial distribution of detected peptides (colored regions). This visualization helps understand which protein regions are accessible for detection and how the inhibitor binding affects different structural domains.
Case Study 2: PARP1 Inhibitor Profiling
Background
This study demonstrates target profiling of a PARP1 (Poly[ADP-ribose] polymerase 1) inhibitor using our chemoproteomics platform. PARP inhibitors are clinically important for cancer therapy, particularly in BRCA-mutated tumors. The analysis identified PARP1 as the primary target with excellent selectivity, demonstrating minimal off-target effects across the proteome.
Quality Control Analysis
Protein Coverage
Comprehensive protein identification across experimental conditions, ensuring thorough selectivity profiling.
Identification Counts
Comprehensive feature identification statistics across experimental conditions, ensuring reliable target profiling and selectivity assessment.
| Feature | CON1 | CON2 | CON3 | CON4 | CON5 | CON6 | CON7 | CON8 | All |
|---|---|---|---|---|---|---|---|---|---|
| Precursor ID | 249,505 | 250,255 | 251,005 | 250,317 | 250,533 | 250,551 | 250,414 | 250,603 | 253,303 |
| Modified Sequence | 189,403 | 190,022 | 190,935 | 190,068 | 190,298 | 190,300 | 190,161 | 190,368 | 192,544 |
| Stripped Sequence | 177,772 | 178,482 | 179,454 | 178,327 | 178,836 | 178,539 | 178,639 | 178,826 | 180,650 |
| Protein Accessions | 7,864 | 7,870 | 7,901 | 7,862 | 7,875 | 7,865 | 7,864 | 7,884 | 7,914 |
Interactive Volcano Plot
Explore the comprehensive selectivity profile interactively. PARP1 stands out as the sole significant hit, demonstrating excellent target selectivity. The interactive plot allows detailed examination of all detected proteins to assess potential off-target interactions.
Target Profiling Score
Score Distribution
Distribution of Target Profiling Scores. The score combines multiple experimental features to rank potential targets.
Score Scatter Plot
Scatter plot of shuffled-data–derived null scores versus Target Profiling Scores.
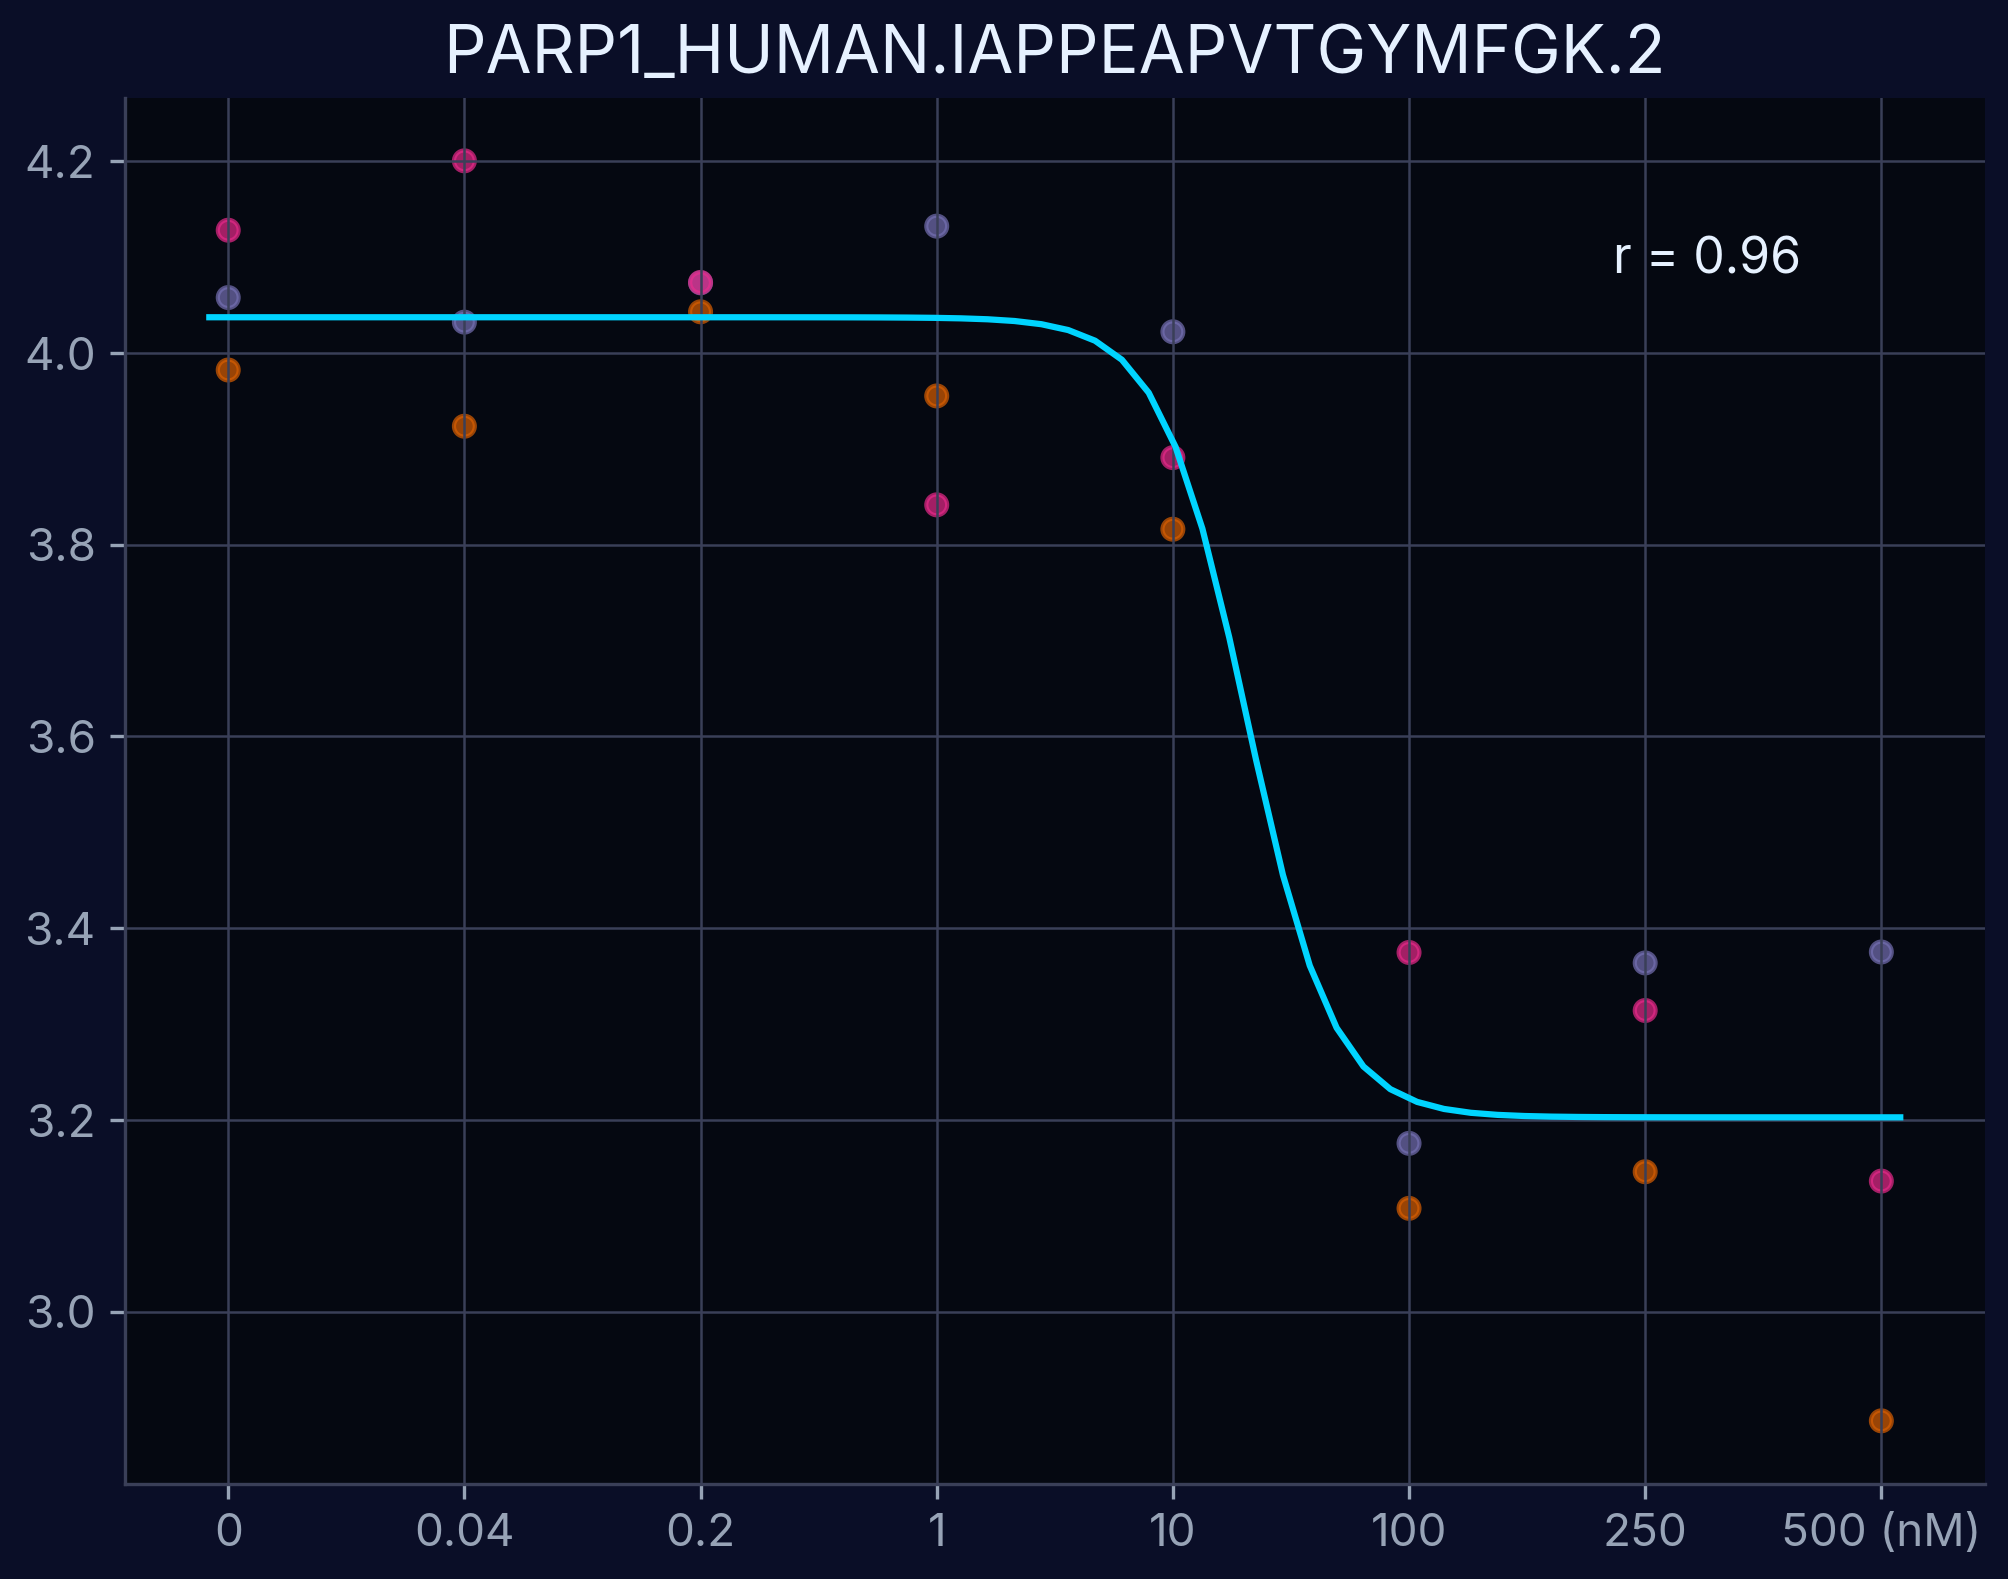
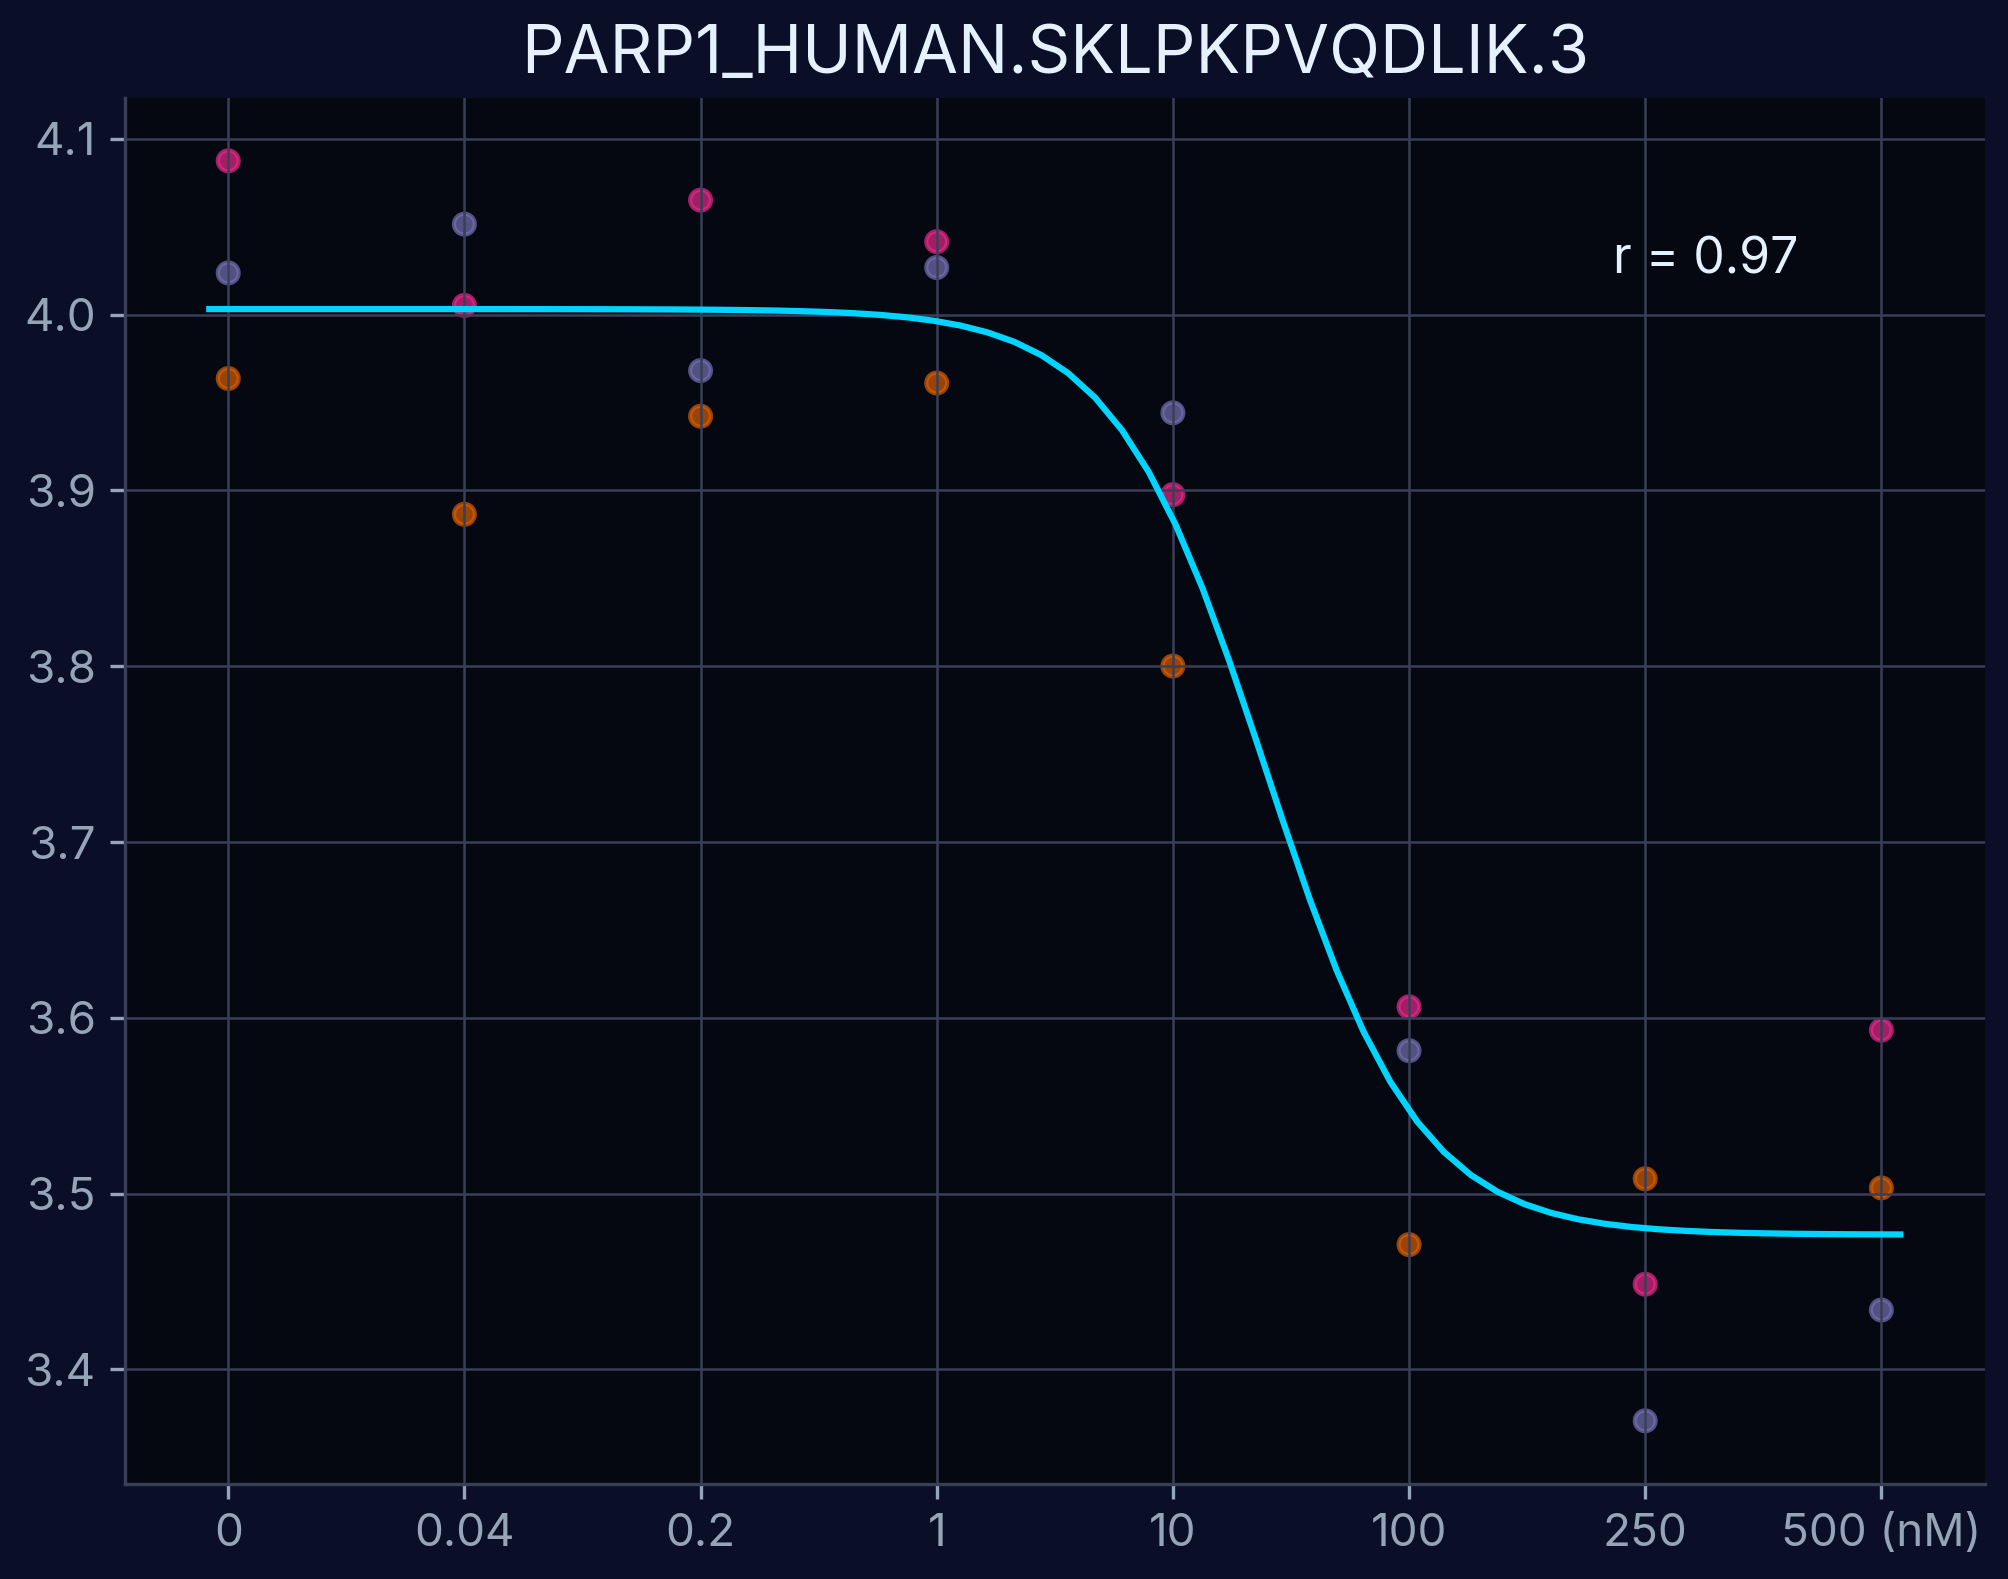
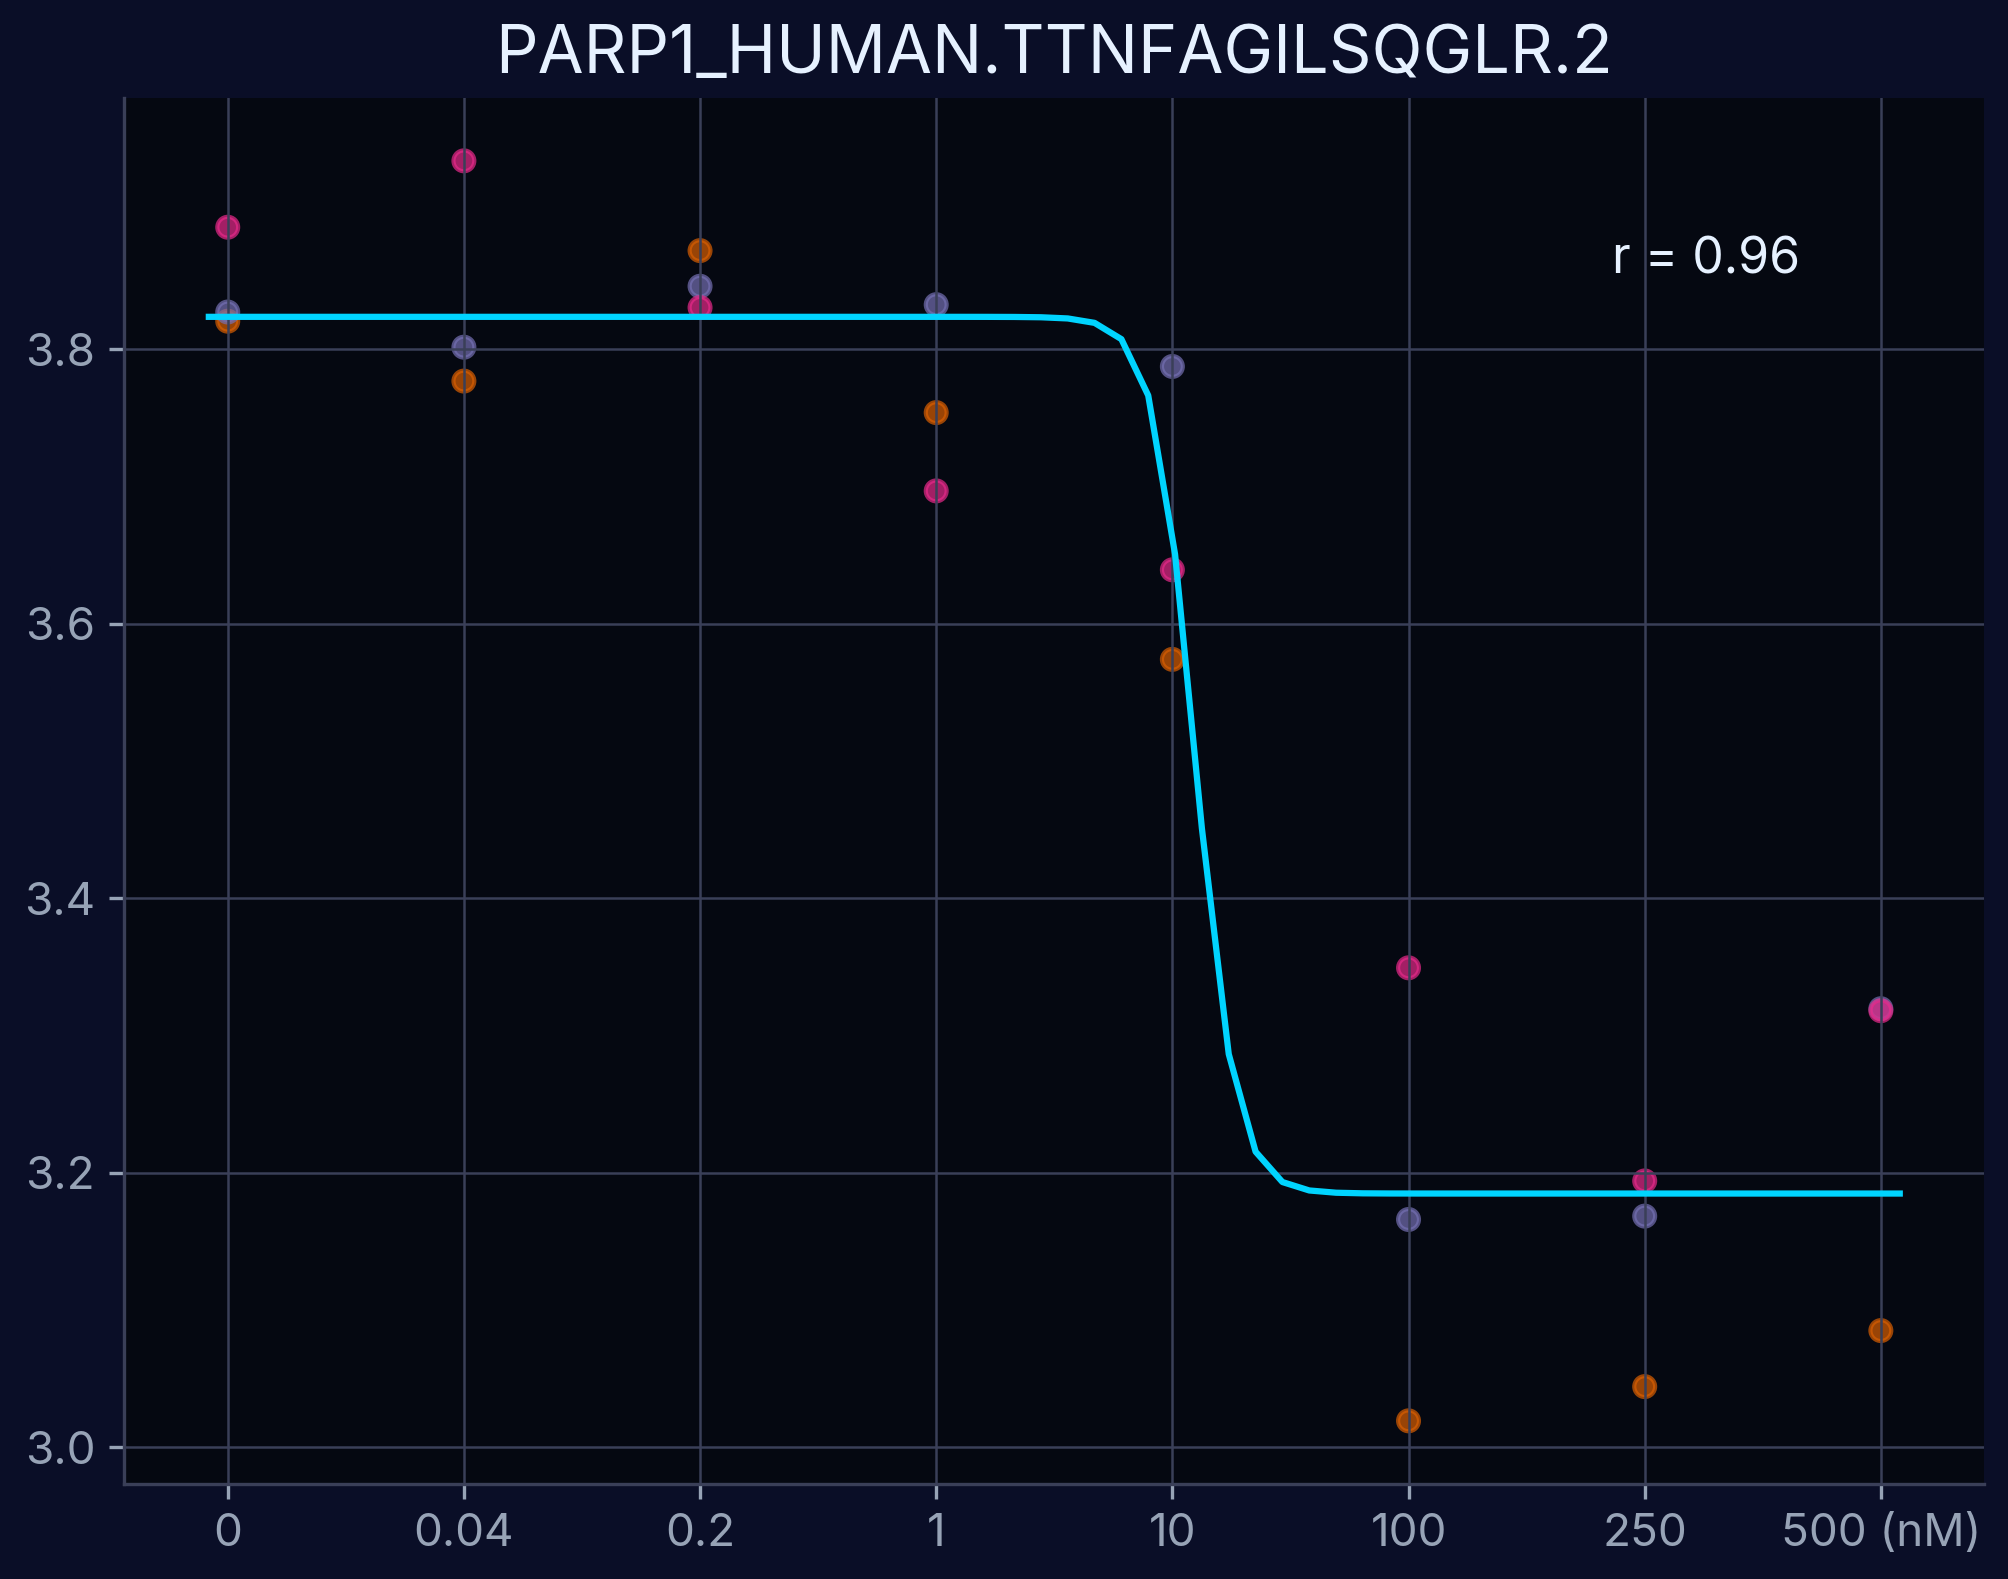
Dose-Response Curves
Dose-response curves demonstrate the relationship between compound concentration and proteolytic resistance changes. Each curve represents an individual peptide derived from the target protein, showing dose-dependent proteolytic resistance upon compound binding.
PARP1 - IAPPEAPVTGYMFGK
PARP1 - SKLPKPVQDLIK
PARP1 - TTNFAGILSQGLR
Target Protein Structure
PARP1 3D Structure with Identified Peptides
Three-dimensional structure of PARP1 highlighting the detected peptide regions (colored). The visualization reveals comprehensive coverage of the protein structure, demonstrating robust detection across multiple structural domains and confirming reliable target identification.